Background
Environmental studies is about connections…the connections that matter. It’s easy for environmentalists to say “everything is connected to everything else” (Barry Commoner), but this doesn’t tell us how and why things work, and how we can possibly influence or change things. This is why our ENVS Program encourages you to focus on the relations between issue-specific actors (the agents that potentially affect your issue) and processes (which relate these agents in particular ways), in an approach broadly known as actor-network theory or ANT, so that you can better understand—and hopefully change!—the world.
We often draw concept maps (sometimes called mind maps) of actors and processes in our ENVS courses; here is a help page introducing you to concept mapping tools, with CmapTools (the one we use below) at top. Basically, concept maps have two things: concepts (actors, represented by boxes), and propositions (processes, represented by arrows connecting boxes). But mapping actors and processes involves more than just knowing how to do a concept map! Let’s first compare better and worse concept maps, then provide you a scoring rubric so you can make sure and do good a high-quality job of mapping actors and processes.
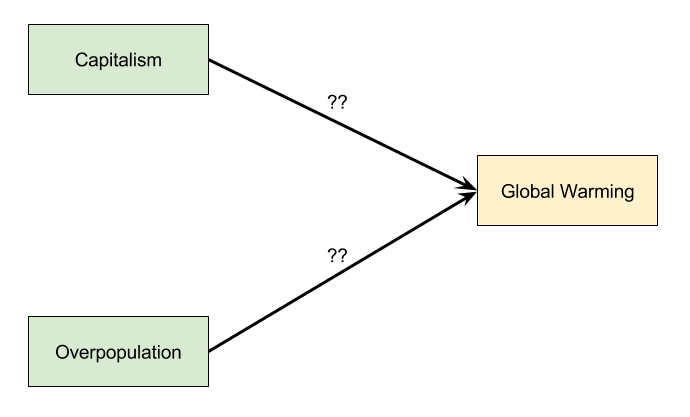
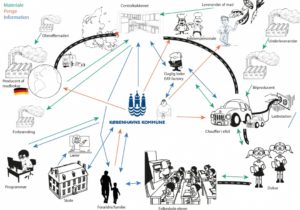
A bad example
Let’s start with, well, a bad actor-network map. This map summarizes how people often talk about climate change: they call it something general like “global warming,” and they attribute it to just one or two vague causes, like “capitalism” or “overpopulation,” without specifying exactly how these causes result in global warming (thus the “??” labels). Also, note how the only actors are humans (capitalism and overpopulation); the nonhuman component (climate, or “global warming”) is simply acted upon; this is a no-no in actor-network theory, which includes nonhuman as well as human actors. So, here are some key conceptual problems with this actor-network map:
- Its key actors (concepts or boxes) are overly general, thus vague
- Its key processes (propositions or arrows) are unspecified, thus no clear cause-effect relationship
- It separates humans (actors) from the biophysical world (which is simply acted upon)
There could have been other ways to make a bad actor-network map; for instance, it’s common to include too many actors and processes, with no clear delineation of the connections that matter. But for now, just remember that good actor-network maps have a wide range of clear, specific actors with clear, specific processes connecting them.
A better example
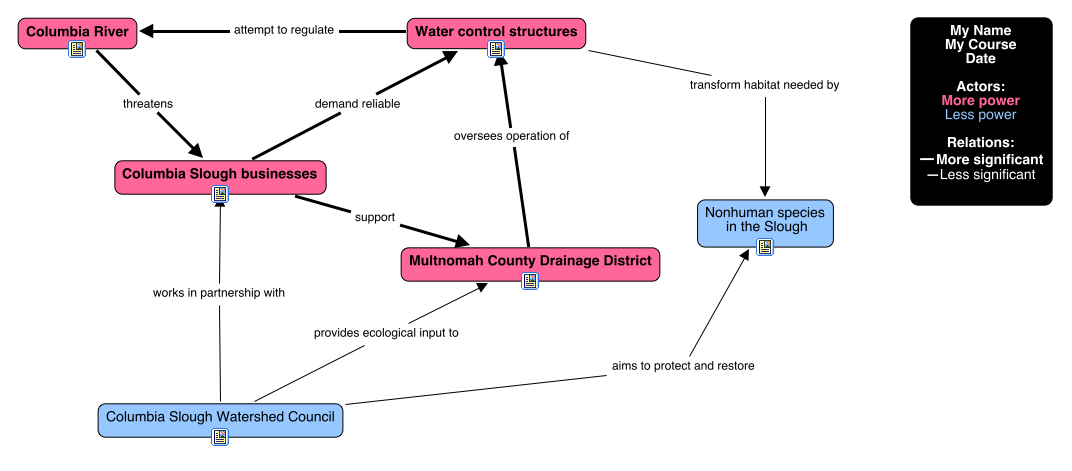
Now, let’s consider a better (not perfect!) actor-network map; this one is of a few key actors and processes shaping the Columbia Slough in Portland, Oregon. Though it’s possible to do a reasonable actor-network map at larger scales, a situated context such as the Columbia Slough can really help. Let’s note some key strengths of this ANT map, first contrasting it with the map above:
- The key actors are specific: not just “nature” and “society,” but the Columbia River, water control structures, and the Columbia Slough Watershed Council! (There arguably are other key Columbia Slough actors missing from this diagram; for now, simply note that they are much clearer than the highly general terms used above.)
- The processes that connect these actors are all (briefly) specified: for instance, Columbia Slough businesses demand reliable water control structures, which thus attempt to regulate the Columbia River.
- There is a diverse range of actors, including hydrological systems, engineering works, nonhuman species, and public and private institutions, all interrelated—pushing and pulling each other—via a variety of processes. These arguably cover the full range of processes Sack summarizes via nature/social relations/meaning (info here), or that contribute to the making of a place (see top of page here).
- The formatting scheme (as summarized in the legend) does not invoke tired old categories (e.g., “natural”/”human”) to differentiate actors/processes. In this case, differentiation is coded as per more/less powerful actors, and more/less significant processes, in the actor-network.
This is not a perfect Cmap: for instance, a focus question, to help the viewer appreciate exactly what this Cmap attempts to clarify, would be helpful. But it does avoid some of the big problems (e.g., vague concepts, no processes, tired distinctions) noted in the Cmap above.
Recent student examples
Students from ENVS 400 2016-17 and 2017-18 produced a variety of ANT Cmaps. Here are some examples:
- Hannah Smay’s ANT Cmap depicting literary imaginations of the Kobe earthquake (overview here; Cmap here)
- Julia Revier’s ANT Cmap of French/Senegalese interactions over key agricultural products (overview here; Cmap here)
- Frances Swanson’s Cmap (more a concept map than an ANT Cmap) of climate action leaders in the Bush administration (overview here; Cmap here)
- Jay Chu’s ANT Cmap of Oregon’s Elliott State Forest (overview here; Cmap here)
- Charlotte Copp’s Cmap of climate change in Ísafjörður, Iceland (overview here; Cmap here)
If you have, or know of, a good example of an ANT Cmap, please email the ENVS Program and recommend it!
Summary rubric
Here, then, are the elements for you to include in your actor-network maps, with a score for each (10 pts possible).
- 2 pts: Clear title, legend differentiating actors/processes, and focus question
- 5 pts: Actors (concepts/boxes) are
- The most relevant ones (2)
- Not too many, not too few (1)
- Appropriately specific (1)
- Appropriately diverse (1)
- 3 pts: Processes (propositions/arrows) are
- The most relevant connections between actors (2)
- Appropriately specific (1)
You may also be asked to submit a brief text summary of your actor-network map. A good textual summary (10 pts possible) would include an embedded ANT Cmap (see concept mapping help page to embed your live Cmap), and conveys:
- 2 pts: Background and situated context of the issue you are examining
- 3 pts: Discussion of included actors, with a summary of why you chose them and what role they play
- 3 pts: Discussion of key processes connecting actors, with a summary of resultant network links, disconnects, and feedbacks (acceptable if merged with discussion of actors, but make sure to initially mention key actors and why chosen)
- 2 pts: Summary and implications for understanding, and/or successfully addressing, the issue
Mapping actors and processes is hard work—just as hard as writing a good paper. For many students, though, this visual exercise can be immensely rewarding. Feel free to contact an ENVS faculty member for help as needed.