
The team members include Juliana Prendergast Natalie Casson and Curtis Hall
Introduction and Procedure
For this survey, we wanted to look at and analyze the thoughts and concerns on climate change in our general community. To begin this process, we had to collect data. Everyone in the class went to either downtown Portland or out to the periphery of Portland to perform a survey. The dates that the survey was conducted was between January 23 2017 and February 4 2017, We would ask random people on the street to rank their concern of climate change as a global issue on a scale from 1-10 as well as give us any other comments they had. We then looked at the perceived gender, age, race, and ethnicity of the people we surveyed so we could later search for trends. Of course, not everyone passing in the street would be willing to take our survey which could potentially create a confounding variable in our statistics because of a voluntary response bias. This means potentially only people who felt strongly one way or the other about the data would respond. Acknowledging those potential biases in the data, we looked at what data we did receive attempting to get a feel for how the population of Portland feels about climate change, and how different subsets of that population feel about climate change. We surveyed 143, and on a scale from 1-10 the mean level of concern was 7.65. (figure 1) If you look at figure 1 you can see most of the sample falls into the more concerned side. So generally our sample was relatively concerned about climate change.
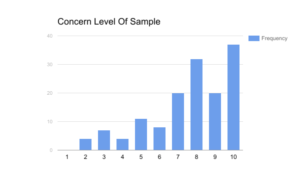
figure 1
Analysis: Gender
First we looked at gender. The proportion of males surveyed was 74, the proportion of females surveyed was 68, and the numbers of other/unsure was 1. You can see this proportion in figure 3. The lowest average of those subsets of the population was other/unsure with a mean of 6; however, we only surveyed one person who identified in that group so that likely can’t be a generalization for the total population. We got a larger group of males and females surveyed, and of those two groups females were the lower of the two with a mean concern level of 7.6. Men had the higher of the two with a mean concern level of 7.72. If you look at figure 2, you can see the frequency distributions of different concerned levels of different genders. These differences are not again going to be completely accurate to the entire population; however, the differences between male and female concern level might be attributed to thought of females putting popular issues today like women’s rights before climate change.

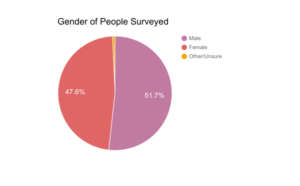
figure 2 figure 3
Analysis: Race
After looking at race, the most obvious statistic is that the vast majority of people surveyed are white. Of all the races surveyed, 78.3 percent of them were white. (figure 4) This fits inline with the most recent census, which shows that the percentage of white people in Portland is 72.2. The concern of all other non-white races was averaged at 7.51, similar to the 7.68 concern level that was recorded in whites. When separated out, black people had an average concern level of 8.11, while latina(o) had an average concern level of 8, both of which are about are about a .4 of a level of concern higher than whites. Asians had an average concern level of 7.6, around the same level as whites, and others had a concern level of 6.92 (figure 5), which is .76th of a concern level below whites when looking at the numbers weren’t a large difference.


figure 4 figure 5
Analysis: Age
Similar to race, the majority of people surveyed were under the age of 30. 52.4 percent of people were under 30, 11.2 percent were 30-60, while 36.4 percent were over 60. (figure 6) One common theme for people around childrearing (20’s-30’s) was that they were concerned over the future of their children. However, when one looks at the averaged concern level, the age group of 30-60 had the highest concern (8.25) compared to under 30 (7.84) and over 60 (7.19). (figure 7) This can be thought of as surprising, as according to Statista’s 2015 study on US concern about climate change, 52 percent of responders under 18 thought climate change is a serious problem, compared to only 49 percent of 30-49 and 38 percent of 50 and older. This shows that our survey of Portland deviated slightly from the survey of the national average.
link here
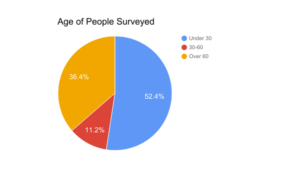

figure 6 figure 7
Analysis: Location
We also split the data from the survey into whether it was collected in downtown Portland or in the periphery of Portland. This was done because when looking at which areas voted for Clinton Vs. Trump in the Portland area it shows that there is a higher concentration of people who voted for Clinton in Downtown and more people who voted for Trump in the periphery of Portland. Although we cannot be sure people who voted for trump are less likely to care as much about climate change we wanted to see if there was a difference in where we surveyed people. We found that the mean of the people surveyed in downtown Portland was 7.81 and the mean of the periphery was 7.30 (figure 9). We were expecting a greater difference in the means since generally republicans and those who voted for Trump tend to care less about climate change. This finding was a bit of a surprised for us.
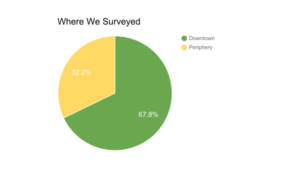

figure 8 figure 9
Comparing our data to national and cross national data
We compared our results to two different polls. One from Pew global and another from Gallup Poll (links below). Our survey found that the average of how important climate change was to them personally was 7.65, from a scale from 1 to 10. In the survey we did climate change was seen as more important than other issues. This differs from the Gallup poll which showed that only 25% of people in the U.S. cared a “great deal” about climate change and 51% worried “a little or not at all”. If we assume that those in our survey care a “great deal” about climate change than 38% of the people we surveyed cared “greatly” which was much more than the Gallup Poll showed. Over 50% of the people we surveyed thought that climate change was rated a 7 or above suggesting that more people in Portland view Climate as an important issue than in the national survey. When we split the data up into genders we found that the mean for females was 7.6 and the mean for males was 7.72 (figure 7). These means were fairly close together which is different than what was shown in the nation poll from Pew Global in which 39% of males thought that climate change was a serious problem and 51% of females thought that climate change was a serious problem. With those numbers we would have expected that there should have been a larger difference in the means and that the female mean would have been larger than the male mean. The difference in percent of males and females becomes even greater in the Pew Global poll when the question was restated by asking if climate change will affect them personally. Only 23% of males thought that it would affect them while 36% of females believed it would affect them. This further shows that the difference between male and female means should have been greater compared to what was discovered in our survey. Overall it from our poll it seems as though the people in the survey see climate change as more of a serious issue than the people in the national polls. The links to the two sites we used to find this information is shown below.
Conclusion
Overall, the data we found showed that the range of opinions in Portland on the topic of climate change. Some people prioritized it in policy making. One woman stated climate change “Should be on the forefront of policy change.”. Others people comparatively prioritized other issues saying things like “Human lives and welfare are most important to me.”. the range of answers we recived could have stemmed from the political views, religions, age, and upbringing of the people that were surveyed. however we would need to do more in depth interviews to really know why there was such a range. How people felt really varied depending on what issues they prioritized, and even though our data isn’t entirely reflective of the larger population, we did find some trends within subsets of the populations that were surprising. For example, the most urban areas had a higher concern level on average than did periphery areas of Portland yet only by a little. We expected this number to be much higher considering generalized political ideology differences between the periphery and downtown. We can conclude that from our data it is very possible that one’s individual identities and beliefs can affect how they look at and think about climate change.