
Ivy Denham-Conroy, Ellen Richards, Ireland Flannery, and Ary Rahul Hashim
Overview and Introduction
The objective of our team, Ivy Denham-Conroy, Ellen Richards, Ireland Flannery, and Ary Rahul Hashim, along with the other teams of the ENVS 160 class, was to assess Portlanders’ views on climate change. Our group, along with the other groups in both ENVS sections, collected the data, encompassing a total of 131 interviewed individuals. The results were then used to compare environmental attitudes in Portland with the larger US population as well as to a global scale. We arrived downtown near PSU and approached individuals with a letter from our Professor, outlining the objectives of the survey, to identify how Portlanders perceive climate change. We asked interviewees to rate the comparative importance of climate change from a scale of 1-10, 1 indicating that climate change is of less importance compared to other issues, and 10 indicating that it is the most important problem we are facing today. We also collected demographic information including race, gender, and age, as well as zip code, and if they were in Downtown Portland or the periphery area.We then took our survey data results and compared it to the rest of the group data.We also took any comments our interviewees wanted to provide to the survey.
Quote from PSU Student: “I’m terrified I constantly think we’re going to die. I think [climate change] is really important and people don’t know enough about it. I still don’t understand why people don’t believe it exists.”

Photo by Ivy Denham-Conroy
Summary and Analysis SectionUsing these variables, we were able to compose information that gave us an idea of how people perceive the threat of climate change by placing these social, cultural, and ethnic details on the x-axis of our graph analysis versus their ranking of climate change on the y-axis.
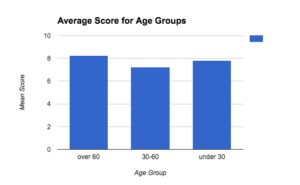
Age analysis
The results for the three age ranges, under 30, 30-60, and over 60 were surprising. Of the 131 people surveyed by our class in both the Portland downtown and periphery areas, 68 people were under 30; 47 people were in the 30-60 age range, and lastly, 16 people were 60 or older. The average score for those 60 and over was 8.25, the highest score, followed by the age group of under 30, which had a mean score of 7.81. The 30-60 age group, which had a mean score of 7.23 scored the lowest among the three age categories. The analysis of these results is limited due to the unequal age demographic of the people surveyed. Despite these limitations, our results indicate climate change as having a relatively equal level of importance within each age group. The below graph demonstrates the mean scores of each age group.
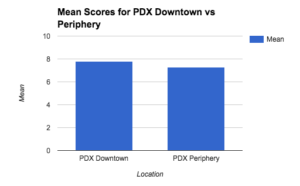
Periphery/Downtown Analysis
Of the 131 people we interviewed in Portland, 92 were surveyed in the Downtown area, while the remaining 39 were surveyed in the periphery. Because of the disproportionate representation of individuals surveyed in the downtown versus periphery areas of Portland, it is hard to make an accurate claim. The average score for a person surveyed in downtown PDX was 7.82, while the average score for someone surveyed in the periphery was 7.28. In conclusion, keeping in mind the disproportionate sample sizes from each location, the people in the periphery viewed climate change as less of a problem than the people surveyed in the downtown area.
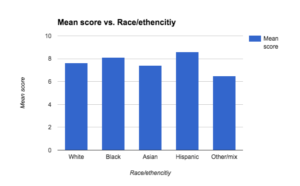
Race/ethnicity analysis
It is difficult to make a reliable analysis based on the results, primarily because the population distribution for each race/ethnicity is skewed towards a majority white interviewee population. Nonetheless, the group with the highest mean score of 8.6 were Hispanic interviewees, indicating that they had a higher level of concern than other groups. The group who rated the lowest on the effects of climate change were the mixed population, who averaged a 6.5. Assessing the chart below, however, shows that people consider climate change as a significant issue, reflected in the feedback from all races/ethnicities, the lowest average was just above 5.
Gender Analysis
As a class, 131 people were interviewed, and for each, a perceived gender identity was recorded. Students recorded 61 people with a perceived gender identity of female, 69 as male, and 1 as other or unsure. This is not a definite calculation since gender identity can not be detected based on appearance. After calculations to determine the average score of different perceived gender identity, we found little difference between the perceived genders. Females had a mean score of 7.69, males at a mean score of 7.67, and other/unsure had a mean score of 6. Based on this calculation, it could be interpreted that the other/unsure category valued climate change less than the male and female gender-identified interviewees. However, since only one interviewee was categorized as other/unsure, this number is not a representative sample of this group. Below is a chart indicating the perceived gender identity demonstrated against the mean score calculated for each group.

National and Cross-National Data Comparisons
Our results are similar to Pew Global Attitudes and Trends Question Database from two 2015 spring surveys (here and here). One survey asked ‘in your view is global climate change a very serious problem, somewhat serious, not too serious, or not a problem’? The other one asked ‘are you very concerned, somewhat concerned, not too concerned, or not concerned at all with global climate change?’. These surveys were given to various countries but did not state age, race, gender or zip code. In both of the surveys, a majority of United States citizens either considered global climate change a very serious problem or they were very concerned about it. There were very few people who believed global climate change was not a serious concern and our class data shows similar results, only 11 people out of the 131 gave a score of two or three. It would be interesting to survey locations in other areas of Oregon to compare with the national results.
The Pew Research survey separated the groups by categories rather than by numerical values. They asked interviewees to choose between four different categories of their perspective of the seriousness of climate change: very serious, somewhat serious, not too serious, and not a problem. If we were to try to quantify this categorical data, we may split it into four categories, each representing 25% of our numerical scale: 0-25% (0-2.5) being “not a problem”, 25%-50% (2.5-5) being “not too serious”, 50%-75% (5-7.5) as “somewhat serious”, and 75%-100% (7.5-10) as very serious. In this way, we can compare our own data to the Pew research data. Our mean for Portlanders was 7.66, falling into the “somewhat serious” category of the Pew scale. On a national scale, 29% of Americans fell into this “somewhat serious” category, presumably where the average Portlander would fall. We then compared this data to global measurements. 57% of the Chinese population indicated that climate change is a somewhat serious problem. Additionally, if we were to compare our results with Canada, 33% of Canadians believing that climate change is a somewhat serious problem. 45% of Americans viewed climate change as “very serious” compared to a slightly higher percentage of 51% in Canada.
Conclusion
All in all, this study into Portlanders’ opinions on climate change yielded interesting data. To obtain a clearer and more comprehensive data set, we would interview a larger and more diverse group. Furthermore, we could distribute a similar survey that would allow the interviewees to categorically place climate change amongst other variables. An example of this technique would be to give them a list of a few (or all) of the sustainable development goals, such as eradicating poverty, eradicating world hunger, and providing affordable and clean energy, etc., and then give them the opportunity to sort through the options from the most important to the least. This strategy would greatly alleviate biases related to conducting the experiment, as we shift the imperative and pressure away from climate change to other real world issues, which could potentially give us a better understanding of the true salience of climate change in the public eye. Another alteration that could be made would be to allow interviewees to indicate their personal identification of their own gender, age, and race, instead of the interviewers noting their guesses. Still, the results from this survey aided us in understanding some of the basic trends in the types of people who value climate change as an important issue or not. As a result of interviewing people in downtown Portland, and comparing our data to the data of 127 other surveys in downtown and the periphery of Portland, we learned that there was not great a disparity between people’s answers based on race, age, gender, and location. These factors are still important to consider and as stated above, if the survey was run differently, these demographics may have shown more significant variation. But perhaps other demographics such as religious and spiritual backgrounds, are important to consider as well. We were surprised to find that some Portlanders gave climate change a comparative value of only 2 or 3. However, for students attending a liberal school in a liberal city, it may seem like climate change is very important and on everyone’s mind, but this assignment revealed that there are some people who really do not understand or value climate change. In comparison to the US in general, we found that our results indicate that on average Portlanders express a lower degree of concern about climate change. On a global scale, results were varied as well.