
By dividing Portland into block groups, I compared the distribution of the land area of tree canopy to other measurements taken by the American Community Survey, including household income, level of education, race, and neighborhood age. This suggests elements of the relationship between the distribution of the urban forest and the population dynamic of the city. I then set up a regression, whose results are shown in the following table. Tree Canopy Proportion is the percentage of each block group’s land area registering over 35 feet in height. Bachelor’s Degree and Proportion White are both the number of residents reporting that characteristic divided by the total residents in each block group, with Bachelor’s degree only reporting for residents over 25 years old. Median House Age uses construction dates to estimate the age of the neighborhood overall.
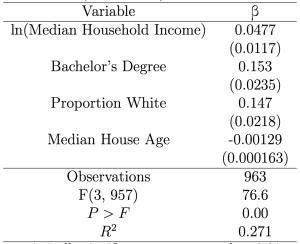
This regression shows a significant relationship between all four right-hand-side variables and the proportion of tree canopy in their respective block groups, with all coefficients over four standard errors from zero. The relationships are substantive—for example, a 1 percentage-point increase in the proportion of tree canopy is associated with a 0.107 percentage-point increase in the proportion of residents with a Bachelors’ degree. This means that, on average, a block group with 60% of residents bearing a Bachelor’s degree would have just over 1% more tree canopy than a block group with 50% of residents bearing the same.
The continuous data of neighborhood analysis, by contrast, lends itself well to com- parison with the distribution of point data throughout the city. In this case, I use the distribution of businesses throughout the city, acquired from the City of Portland based on the address on their business license. The metric of interest is the general level of urban forest in their vicinity, or how proximate they tend to be towards ar- eas of heavy forestation. A method of radius composition analysis is perhaps most appropriate to analyze the distribution of point data with respect to the urban forest.
This method considers the composition of the urban forest within a prospective radius from each point. This is constructed using a buffer of a given radius around each data point, followed by the calculation of zonal summary statistics for each radius. Having determined the levels of urban forest present within each radius, the distribution of points can then be compared to distribution of the urban forest within Portland overall. Comparing the distribution of the means of height composition within the radii to the mean height distribution over the area in which the points are located tests the relationship between the locations of businesses and the surrounding levels of tree canopy.
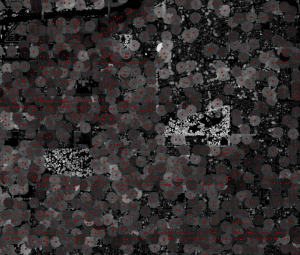
Two t-tests were then run to compare the distribution of tree cover within and outside these radii. The first showed a significantly lower proportion of tree canopy within fifty meters of businesses. When outlying areas of extreme forest cover (such as forest park) were removed, however, the results suggested significantly higher levels of tree cover within the radii.