Lab Team: Liza Tugangui, Audrey Stuart, Blake Slattengren
Background
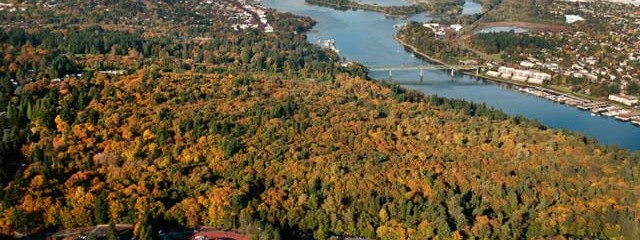
A basic concept in Environmental Studies describes that the biotic and abiotic aspects in an environment are incredibly dependent on each other. In this lab, we wanted to focus on the aspects of a microclimate in Riverview Natural Area. According to Lawrence Mendonca of Stony Brook University, “Microclimates are local zones where the temperature, wind speed, humidity etc. differ from the surrounding area… Microclimates can be present near bodies of water, which have a cooling effect, or in urban areas manmade features absorb energy from the sun, heat up, and then return the heat back into the air in the form of infrared radiation” (Mendonca 2010). Given that RVNA has varying altitudes within its boundaries, as well as varying degrees of canopy cover that would affect data like temperature, dew point, and humidity, we set out to record all of these variables to test if there is a significant relationship between elevation and microclimates.
Descriptive Statistics
“
* Where 1 represents approx. 0%-24% canopy cover, 2 represents 25%-49%, etc.
| Mean | Standard Deviation | |
| Elevation | 140.7 | 37.81 |
| Temperature | 14.7 | 0.424 |
| Humidity | 67.5 | 6.72 |
Analysis
These data are merely suggestive, given that there were a few inconsistencies in collecting the data throughout the class. In the first chart, we compared the data found for temperature and altitude. Without delving too much into inferential, we can see that there is a general negative correlation between the decrease of temperature with an increase of altitude. Temperature is an important factor in microclimates so although with these data we cannot infer too much, this trend is important to note in response to our focus question.
In our next graph, we compared humidity with altitude. These two variables have a lot less of an apparent trend. It is too ambiguous to make any real inferences. In our last graph, we compared another factor, canopy cover, with altitude. Canopy cover was included in our tests because canopy cover is important in microclimates in that it reduces sunlight, which might affect the microclimate enough to change factors like temperature, humidity, and wind. We found a small, questionable trend that could suggest an increase of coverage
Although a majority of our graphs were not helpfully conclusive, the correlation between temperature and altitude would be one we should further investigate.
Discussion
There were a variety of errors that were inherent in our sampling technique. A main issue was that the devices we used were slow to load, especially when switching between the fulcrum and kestrel applications. There were several data points that were immediately deleted because they fell outside of RVNA, showing that at least several of the GPS locations were highly inaccurate.
These results bring up many implications that could be researched further. RVNA is significant because it contains an interior forest habitat, which is characterized by cooler temperatures and increased moisture (Chen et al. 1999). A further study could verify this and see if the most interior parts of RVNA differ in climate from those on the periphery. Our lab group wondered if the properties of the adjacent Willamette River affect the microclimate of RVNA. This could be examined by comparing the various climatic variables with distance from the river.
References:
Chen, Jiquan, Sari C. Saunders, Thomas R. Crow, Robert J. Naiman, Kimberley D. Brosofske, Glenn D. Mroz, Brian L. Brookshire, and Jerry F. Franklin. “Microclimate in Forest Ecosystem and Landscape Ecology.” BioScience 49, no. 4 (April 1999): 288.
Mendonca, Lawrence. “Microclimates of Stony Brook University,” Spring 2010.