Background: We studied how altitude and canopy cover affects microclimate factors, specifically temperature, humidity, and dew point within the River View Natural Area (RVNA), a 146 acre public-use park characterized by mixed deciduous and evergreen species and located in southwest Portland, Oregon. According to Cornell University, a microclimate is the climate of a small area and can have different temperature, humidity, and dew point values from surrounding areas.
Framing Question & Focus Question:
- What is a microclimate and how is it affected by elevation, canopy cover, and other abiotic factors?
- How does elevation affect microclimates in a given area (RVNA)?
Procedure: Six teams of three team members each chose different trails in the RVNA to collect data along within a specified time period. The six routes allowed teams to record data encompassing a roughly even spread of the entire area of the RVNA. Data on three key characteristics (temperature, humidity, and dewpoint), along with GPS altitude were taken utilizing a Kestrel D3 Environmental Data Logger attached to the outside of a backpack of one teammember on each route and then subsequently entered into the Fulcrum application running on each team’s iPad Mini. Teams stopped at roughly 10 meter intervals along their route to record temperature, humidity, dewpoint, and any additional information or observations. All data values from each route were piled into a central datapool on GoogleSheets for the purpose of analysis.
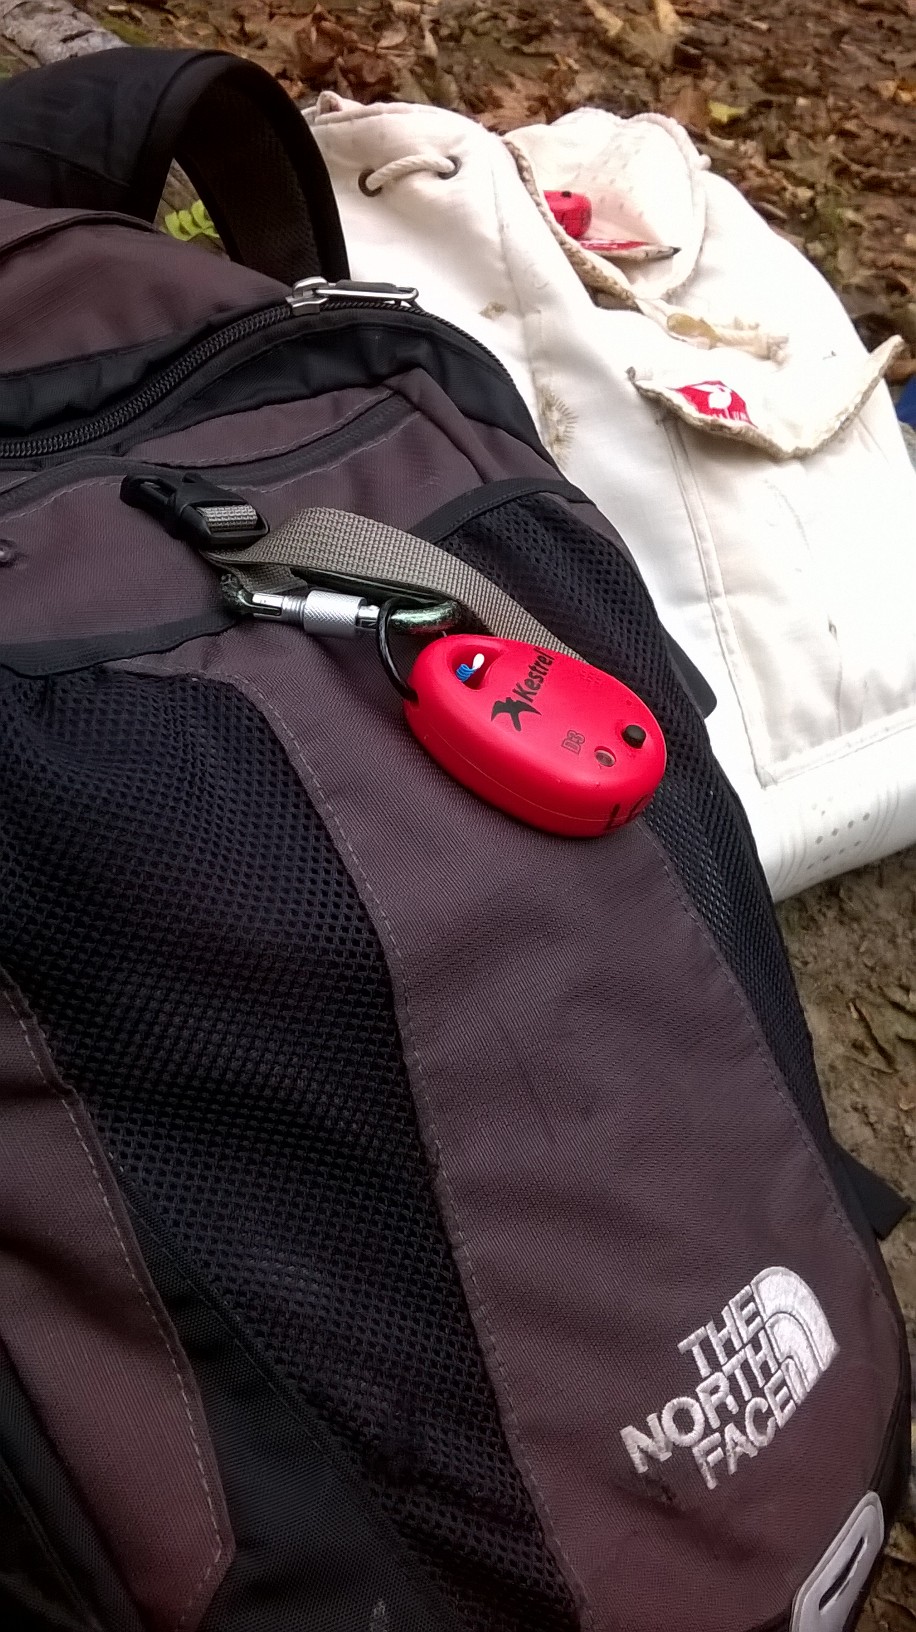
The Kestrel D3’s were attached to the outside of a teammember’s backpack for each route.
Results:
When analysing our data, we noticed an inverse relationship between elevation and temperature. This followed our anticipated data, although the humidity did not have quite as clear of a correlation.
The humidity at higher elevation has notable variation, including higher and lower data points than the humidity at the lower elevations. Humidity at lower elevations, as illustrated well in Fig. 2, was condensed between 70 and 75 and was much higher than the lowest of humidity readings recorded at higher elevations (>100 ft.).
The dew point, similar to our temperature data, had an inverse relationship with elevation.
Discussion:
Before beginning our excursion, we anticipated that, as elevation decreased, the temperature and the humidity would increase, and, subsequently, the dew point would also increase. We believed that a higher temperature would be able to hold higher concentrations of water vapor (humidity), and, therefore, would not require much temperature decrease for the vapor to begin condensing.
When analysing our data, we noticed a trend that, as the elevation decreased, the temperature increased. This followed our anticipated data, although the humidity did not have quite as clear of a correlation. On first look, the humidity at higher elevation has significant variation, including significantly higher and lower data points than the humidity at the lower elevation. The lower elevation humidity, in fact, was well condensed and was much higher than the lowest of humidity noted at the higher elevation. We believed that this data collection could have been from a number of environmental factors, namely that at the higher elevation (and beginning of data collection), there was a light rain, which tapered off as the time progressed, and altitude decreased. While we do not feel like the humidity graph shows this correlation, we still believe that the humidity would have been higher for lower altitude. Although we were not able to test this, we believe that if the light rain had continued once we were at a lower altitude, the lowest humidity for that altitude would have stayed relatively the same. The highest humidity, however, would have been much higher.
The dew point, like our temperature data, had a trend that increased as the altitude decreased. This is one way in which we can make assumptions about our humidity, because the humidity and temperature both affect the dew point. In other words, the dew point data is a tool to compare the temperature and humidity and to make sense of the (potentially) skewed humidity data.
Percentage of Error: One of the Kestrel D3 machines did not calibrate with the others so there will be some percentage of error in our overall data. Additionally, some teams logged average dew point, while others logged specifically located dew points.
Conclusion: This lab exercise helped us further our research standards by presenting the challenge of standardizing methods and procedures for separate teams to replicate while collecting data. In addition, we had the opportunity to interpret the data and discuss any significant trends. While we did not utilize any statistical calculations in interpreting the significance of the data trends, we did come to a consensus that both temperature and dew point had negative relationships with elevation. In discussion, we agreed that humidity would also most likely have a negative relationship with elevation, but the data was unreliable due to the presence/absence of rain during the time data was collected. Future work should involve further data collection of the same and new routes, refinement of the methods to create a more replicable procedure, and observations of species and biotic factors present at different microclimates; this last addition can reveal relationship between microclimate and biotic factors.