To further investigate gentrification and restaurants in Portland, we created GIS maps of both the rise in median home values and net change in Black population, mapped against geocoded trendy restaurant locations. We used census tract level data from the 2013 American Community Survey (American FactFinder) and from the 1990 census, adjusted to the 2010 census tract boundaries (US2010). We adjusted the housing price figures for 1990 by multiplying them by the CPI inflation value (1.78) between 1990 and 2013 (BLS). We then found the percentage increase in median home values by census tract, by dividing the difference by the 1990 value. To compare to this map of rising property values, we created one of the net change in Black population, subtracting the number of Black residents per census tract in 1990 from that in 2010. Our created maps can be viewed below.
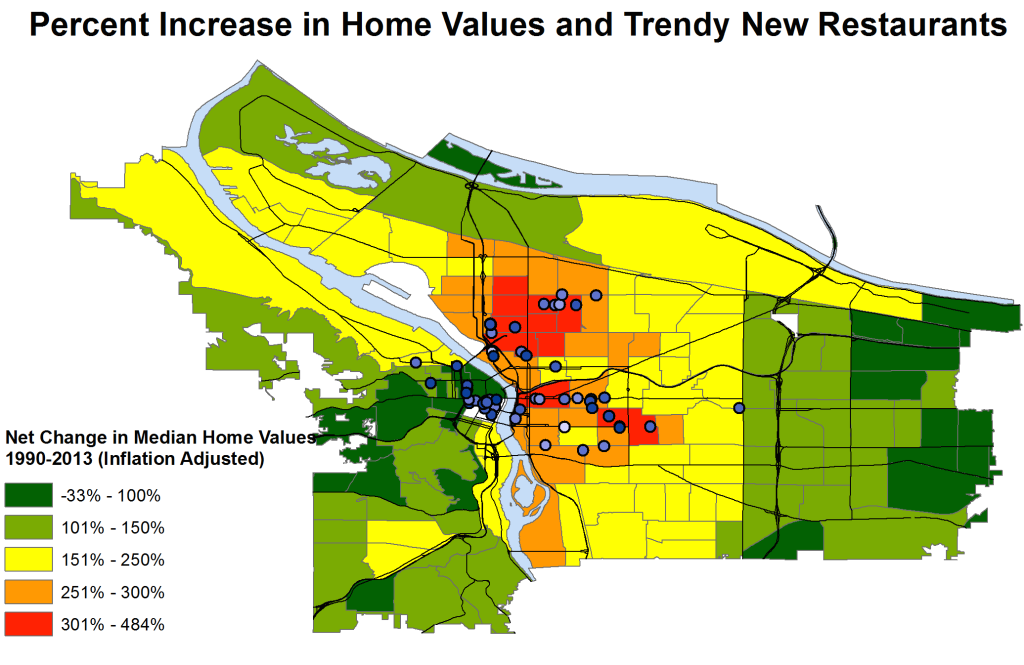
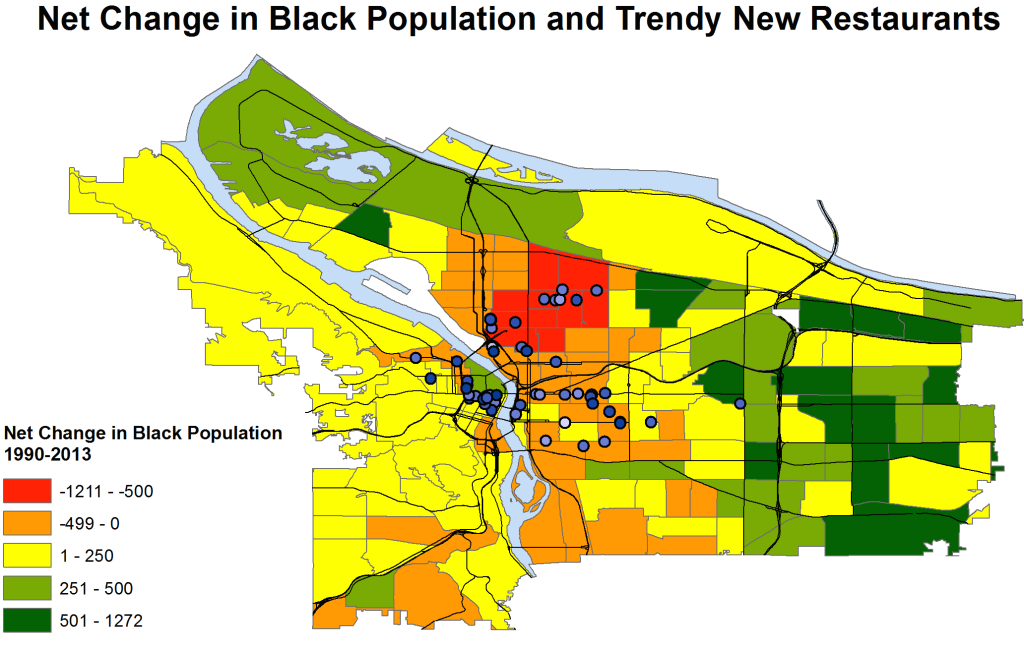
Before bringing restaurants into this analysis, we think it is important to pause and appreciate the empirical scale and distribution of variables we selected as markers for gentrification. In North Portland and the Inner Eastside, home values have increased over 250% over just twenty years, even accounting for inflation; those same neighborhoods have seen a marked decrease in Black population over the same time period. These patterns are accompanied by a significant increase in Black population in the outer Eastside, past 82nd Street, where home prices have increased less than 150% in real terms; there, the Black population has increased by approximately the same amount that it has decreased in North Portland. The corresponding increase in Black population, however, has been more dispersed than its decrease; the census tracts in North Portland noting a decrease of greater than 500 Black residents were contiguous and geographically concentrated; those noting a increase greater than 500 Black residents are dispersed across a broad swath of land, covering roughly half the city. This has important implications for community social relationships; Rev. Hardy, of the predominantly Black Highland Christian Center, remarked that many of the families attending his church still “have to commute back into the city to get hair-care products, and to visit people who still remain in inner Northeast Portland.” (Pein 2011) The dispersal of the Black community throughout East Portland, inextricably connected to the gentrification of North Portland, thus diminishes social and cultural capital for this community.
To look at gentrified restaurants against this empirical spatial evidence of gentrification, we searched for “trendy hip restaurants” in Portland, Oregon on Yelp, sorting the results by best match, and manually filtering out false positive matches (i.e. restaurants which popped up because of comments saying it was not trendy). We noted the name, address, year of establishment (found through a combination of searching About pages, the Willamette Week restaurant reviews, and the oldest Yelp comments, which sometimes mentioned the opening date). We then geocoded the data using a free web locator service (MapChannels), noted and imported the longitude and latitude coordinates, and plotted each restaurant as XY Data in ArcGIS. After we turned this data into a shapefile itself, we plotted the year of establishment as the color of the dot; the range of years is from 2000 (white) to 2014 (dark blue). An examination of this data reveals several things. First, many of the top trendy restaurants in Portland are extremely new, and many of them are less than a decade old. This may largely be a mere reflection of the rapid turnover of the restaurant industry, yet this fact about the restaurant industry means that it functions as a rapidly responding indicator of the changing geography of capital and taste. Second, this geography of capital and taste over the past decade-or so in the hip restaurant business has focused overwhelmingly on central Portland, including the Pearl District, Northwest Portland, and Old Town, on the Westside, and on Lower and Upper Albina in North Portland, and some central Eastside neighborhoods. On the east side of the Willamette, the geography of new trendy restaurants is strikingly similar to that of gentrification; nearly all of the trendy restaurants there are found in census tracts which have seen a rise in inflation-adjusted housing prices greater than 250% and a net decrease in black population. On the west side of the Willamette, gentrification has taken a different form; there, the reinvestment has been largely in prior industrial or purely commercial spaces, (Abbot 2004) and the existing residential development was more affluent than in North Portland.

Redlining in Portland, 1938; from TAHPDX, Historic GIS Data
It is important to note the connection between our maps of gentrification—as expressed both through changing socioeconomic indicators and the location of new restaurants—and maps of structural disinvestment and reinvestment, as focused on North Portland. The areas our map highlights as gentrifying overlap significantly with the map of redlining in 1938 in Portland, especially when looking at Lower Albina and Central Eastside. Additionally, the urban core reinvestment has occurred largely within the bounds of the contemporary urban renewal zone—“a state-authorized, redevelopment and finance program designed to help communities improve and redevelop areas that are physically deteriorated, suffering economic stagnation.” (Portland Development Commission) These urban renewal areas consist of areas deliberately targeted for revitalization through planned reinvestment, and take out bonds based on future property tax increases to pay for streetscape and transportation improvements. Government policies, then, played a vital role in the gentrification of inner Portland, yet perhaps not a wholly-encompassing one; note the urban renewal zones in East Portland, which, despite targeted government investment, have not become gentrified. The incorporation of cultural amenities seems necessary to discuss the full process of gentrification.