To analyze the potential price effects of the introduction of light rail, I conducted a hedonic analysis of home sales within 1.25 miles walking distance of each of the stations that occurred between 2008 and 2016. Hedonic analysis is a way of inferring the value people attach to components of a market good. It obtains estimates of the contributing value of each component via regression analysis in which their effect on the independent variable is found while holding all other variables constant. For housing, such components consist of the structural, neighborhood, and transportation attributes.
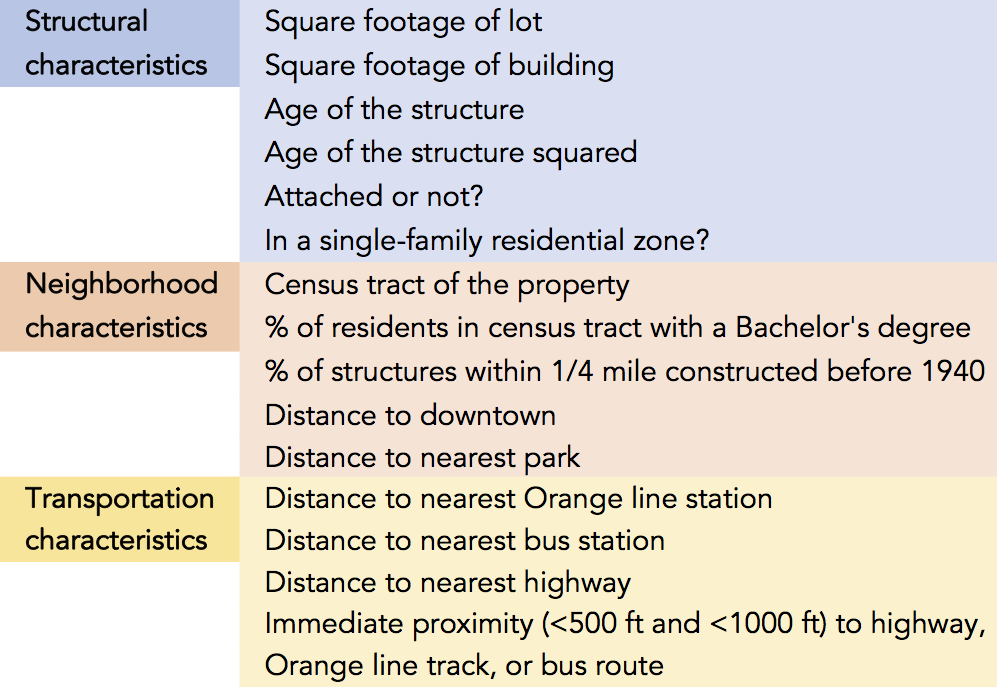
I examined housing sales near the Orange Line with respect to both the timing of the sales and by the proximity to individual stations. The primary data source used for this analysis was the County Assessor’s records of property sales, building area, and lot square footage. I calculated the key independent variable for my study—network distance to stations—using the Network Analyst tool in ArcGIS. I chose to measure walking/network distance as the hypothesized price premium of transit is generally considered to be a function of people valuing the accessibility benefits of transit (Higgins and Kanaroglou 2016); these benefits are only accessed through the street network. I controlled for:
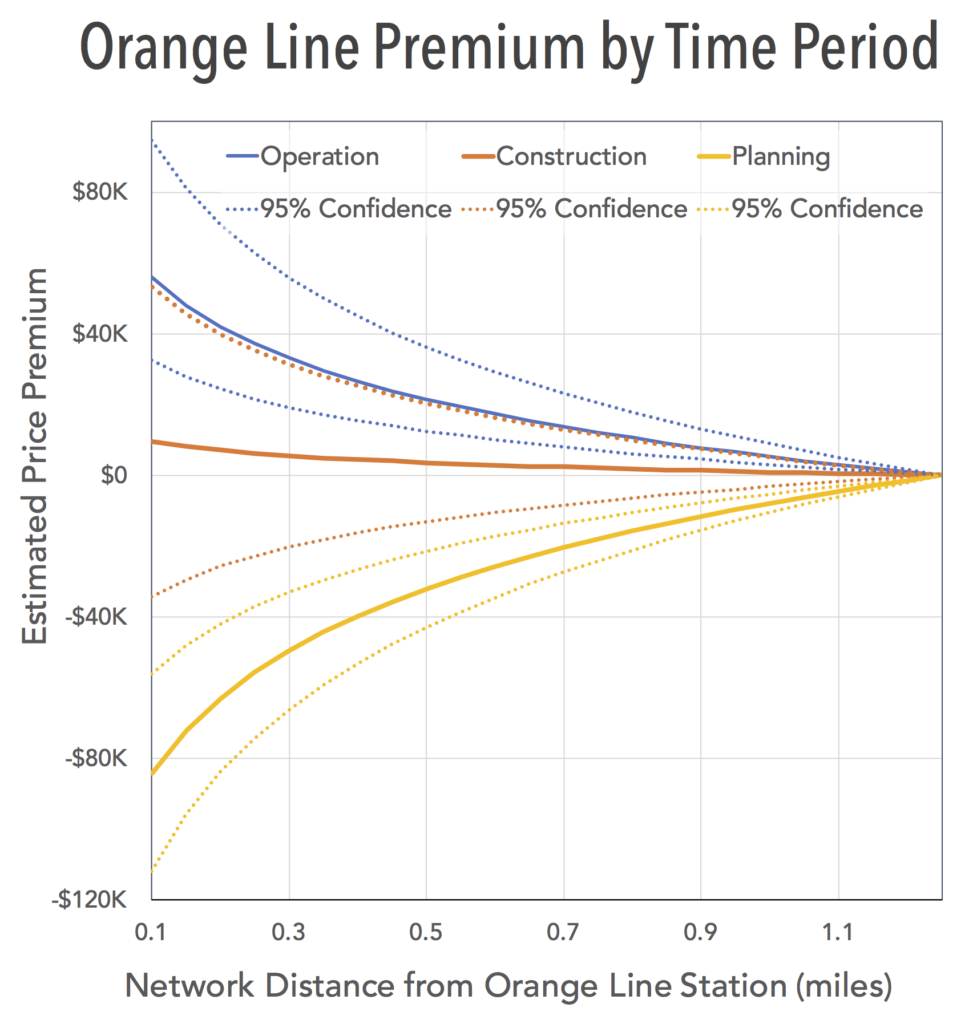
I created three time periods for the stations—planning (January 1st, 2008-June 30th, 2011), construction (July 1st, 2011-September 11th, 2015), and operation (September 12th, 2015-October 27th, 2016—and conducted the ultimate regression on each period, along with the time period as a whole. The beginning of construction on Tilikum Crossing was chosen as the demarcation point between planning and construction, though designs had not been completely finalized by that point. This time series regression clearly illustrates the emergence of a light rail price premium, with a statistically significant price premium arising during the operation period, on the order of $50,000.
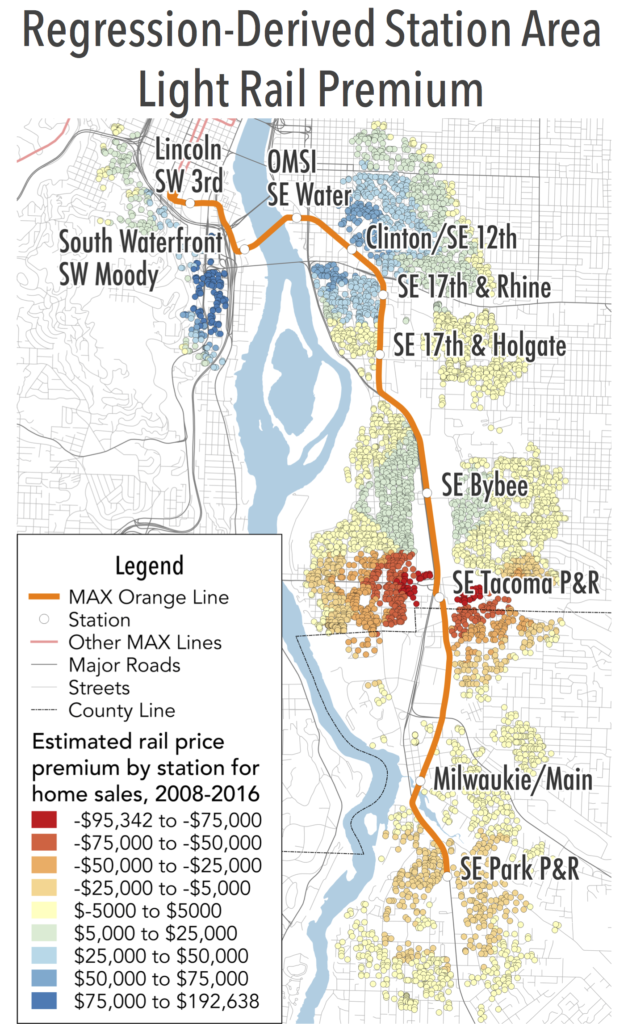
My individual station analysis considered each station area independently, finding the effect of proximity to the station on price over all time periods considered. Data limitations precluded me from disaggregating these results by time period, as there would have simply been too few data points in some of the analyses for linear regression to produce reliable results. It is thus important to note, then, that this station analysis is static, and does not necessarily distinguish between effects related to the deployment of light rail from prior conditions at the stations. There is a statistically significant amenity effect for the Clinton St, South Waterfront, and Rhine St stations—the close in stations which have been planned for the most significant redevelopment. There is a statistically significant disamenity effect for two park and ride stations, at Tacoma St. and Park Ave.