Map and Text by Laurel Garrett and Jhana Valentine
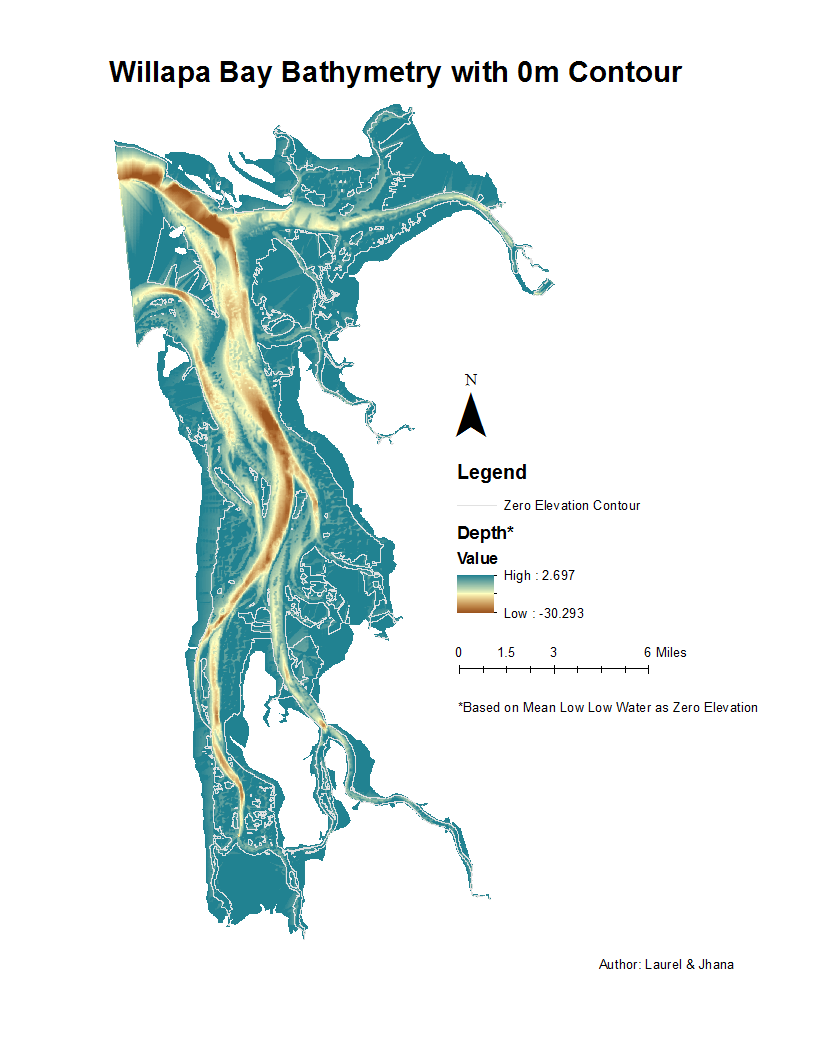
The map above shows the bathymetry of Willapa Bay in Washington State. The area has been under scrutiny lately as the massive chemical eradication of Spartina alterniflora, an invasive cordgrass, is winding up. Many oysters farmers working in Willapa Bay claim the bay is the most pristine estuary along the West Coast. While this is debatable, the estuary is certainly among the most productive in the United States. The everyday inflow and outflow of water from the Pacific Ocean is vitally important to maintaining the health of the bay and to the production of oysters and other shellfish. By understanding the bathymetry of the bay, we can begin to see more clearly how this important ecosystem functions.
Like any estuary, tidal fluxes play an important role in flushing water in and out of the bay. In Willapa Bay, there are two high tides and two low tides per day. For our analysis, we use the highest high tide and the lowest low tide in order to capture extreme values. A result of this assumption is that our calculations represent values that are higher than in an average day. This study was comprised of eleven surveys and and 75,491 soundings, which used Digital Elevation Model (DEM) format bathymetry data. This data was collected by NOS Hydrographic Surveys Division at 1 arc-second (30m) grids. The extent of this data goes to the highest water line. As you can see in Figure 2, zero elevation is defined as the mean lowest low tide line over a 19 year period.
Using the arcGIS 3D Spatial Analyst tool we calculated that the approximate volume of water present in the Bay at mean lowest low tide is 917,351,555.69m3. To find the volume of water at the highest high tide, we averaged the mean higher high tide levels from three centrally located points in the estuary, Toke Point, Nahcotta, and Bay Center. This data was made available on NOAA’s Tides and Currents website. We found the overall mean higher high tide to be 3.68 meters. We chose to use mean higher high tide measurements because this would estimate the highest influx of water into the bay during a day. Again using the 3D Spatial Analyst tool in arcGIS and high tide measure of 3.68 meters, we got a higher high tide water volume of 2,046,972,542m3. The difference between the higher high tide and the lowest low tide is called the Great Diurnal range. By subtracting the lowest low tide volume from the highest high volume, we found the volume of water in this range is 712,654,301m3. Thus 45% of the volume of water at higher high tide is flushed out by the lowest low tide. That is about 285,061 Olympic swimming pools drained in just 6 hours!
Given that the mouth of Willapa Bay has an area of roughly 34,000m2 and there is a 6-hour difference from low tide to high tide, the mean velocity of water at the mouth of the bay is 3,493.4 meters per hour. The velocity of the water at the mouth is approximately the same as a human taking a leisurely stroll. A large volume of water being replaced each tidal cycle contributes to the pristine conditions of the Bay by flushing out chemicals. This map and analysis provide a quick visual and numerical summary of tidal fluxes in Willapa Bay.
Sources
http://estuarinebathymetry.noaa.gov/
http://tidesandcurrents.noaa.gov/datum_options.html