This class is in preparation of the public demand for facts, figures, and charts to prove any environmental claim that I make. Using the tools introduced in this class, students in Environmental Studies (ENVS) work together to efficiently develop appropriate questions, and collect and analyze data that demonstrates their understanding of the class. ENVS 220 is a methods class for the major, meaning that while the questions researched in class have some relevance to general environmental topics, we are more concerned with the how and why of data collection, not the what. As the kind of person that is more interested with the what, taking a methods course is new terrain to me.
On top of group work and lab write-ups, we have separate posts to help ENVS students collect their musings and thoughts on what is introduced to them, and help the public briefly explore the inner workings of the ENVS major or minor. Parallel to work in class, majors independently carry out concentrations in which they propose, develop, and research a topic of interest. The concentration process centers around asking the types of questions that will effectively and efficiently bring a topic into context. These questions are broken into four categories: descriptive; "what is it?", explanatory; "why is it happening?", evaluative; "is it good or bad?", and instrumental; "what can we do about it?".
The first of many labs used Fulcrum to gather temperature, humidity, and dew-point of microclimates in River View Natural Area. The challenging part of this lab was to get the hang of smoothly running through a lab, analysis, and write up in one day.
For our second lab, my lab group used the SPSS Database to analyze the relationship between the Healthy Average Life Expectancy and the NET agricultural output of a given country. Because we found a strong correlation between our two variables, we used ArcGIS to map the information. For me, ArcGIS is the most understandable because we worked with the program two weeks in a row. For our second use, we mapped areas of Portland in relationship to the air quality and pollution rates. During this lab, we talked a lot about environmental justice and site versus source.
The main part of our literature analysis lab revolved around the concept of coding, particularly the way in which to code text. When we had finished enough of the data collection and analysis to make conclusions, they did not come along with the satisfaction of working through a complicated computer program.
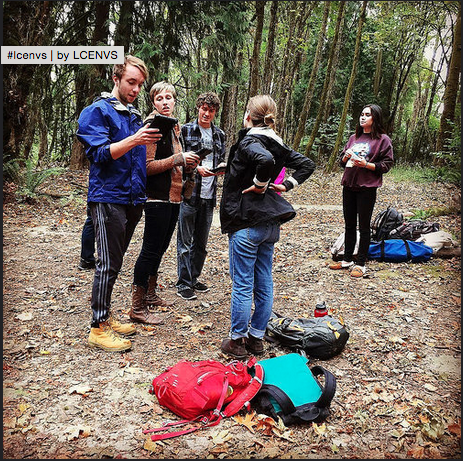
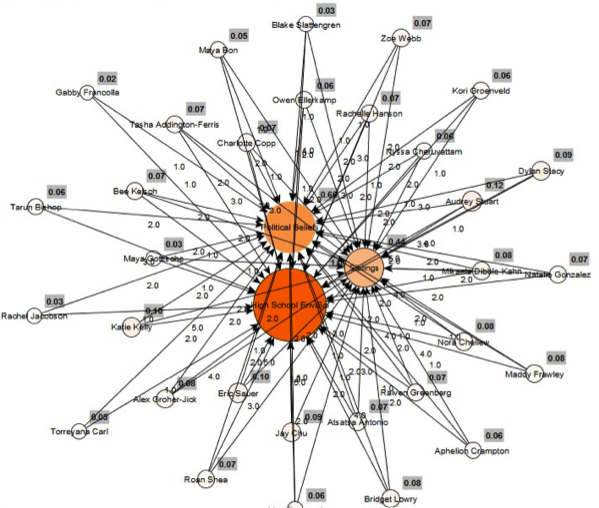
Similarly, when working on social network analysis, I thought that we would be learning about a complicated networking map program. The focus of the lab, it turned out, was about how to effectively gather and then code the data to be mapped. To continue to theme of coding, we went back to some tools from our first lab to help with surveys. Using Fulcrum, we worked on creating effective surveys, and then took iPads around campus to collect results.
We coded each response and used SPSS to run our data to look for significant relationships between potential cause and affect variables. The most important part of creating a useful survey is to have questions that makes sense and result in data that can be analyzed easily and effectively.
To finish off the semester, each lab group conducts their own research using the tools from the class. Maya, Jay and I (group BonAddChu) are studying the affects of community gardening in Portland on quality of life. Our research focus on ArcGIS, SPSS, and qualitative analysis and will be presented with our website page, poster, and video. This is a final culmination of our ENVS 220 work and will help to set us up for the remainder of our time in the major program.
Related Posts
Quotations from CAN YOU DIG THIS
This chart depicts various quotations we gathered from the discussion after the film screening of CAN YOU DIG THIS by Delila Vallot. These quotations are from four individuals who spoke as a panel after the film screening. We created four classifications to dissect these quotations: opinion on the feasibility of gardening for low income individuals, […]
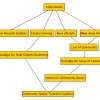
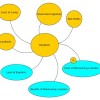
Actor Network Map 2.0
Here is our updated actor network map! We are looking at the ways people living in cities seek a sense of community through creating gardens as common spaces. In addition, we are exploring the nostalgia stemming from the disconnect of personal food growth in urban areas. These two factors converge to motivate individuals to create […]
Synthesis of Our Progression
Today in lab, our group finalized our project topic. We had been grappling with multiple different potentials for our topic, ranging from how non-permeable surfaces impact microclimates to how urban gardens shaped as “wildlife-friendly” habitats benefit biodiversity. On top of the difficulties surrounding trying to create a broad, non-place specific framing question, we were finding […]
Actor Network Map
Here is our actor network map thus far. We are expecting that it will shift and grow as we work on our project further!

New stuff
Framing: What are the impacts of and who are impacted by urban agriculture? Focus: How do communal urban gardens in middle to upper socio-economic areas create community and impact overall health and wellbeing? We are connecting with another group in ENVS 220 to pool results in order to understand this topic further. This other group is researching […]