
Figure 1: Proximity to Green Spaces in Portland
This first map, figure 1, shows proximity to green spaces in Portland. This confirms the background research stating that green spaces are more heavily concentrated in the western neighborhoods of Portland. Then these statistics were analyzed compared to the population change for the top 12 neighborhoods in terms of population growth and the top 12 neighborhoods in terms of population decay in Portland. We hypothesized that areas with high population growth have pressure to develop land for housing instead of growing urban green spaces. This trend appeared to hold true in the city of Portland, as shown by the summary statistics table. A p value of 0.026 indicates a significant correlation between percent population change and proximity to green spaces.
Figure 2: Green Space Proximity of Portland Neighborhoods with Most Population Growth
Figure 3: Green Space Proximity of Portland Neighborhoods with Most Population Decay
Figure 4: Statistical Analysis of the Relationship between Populations and Green Space Proximity
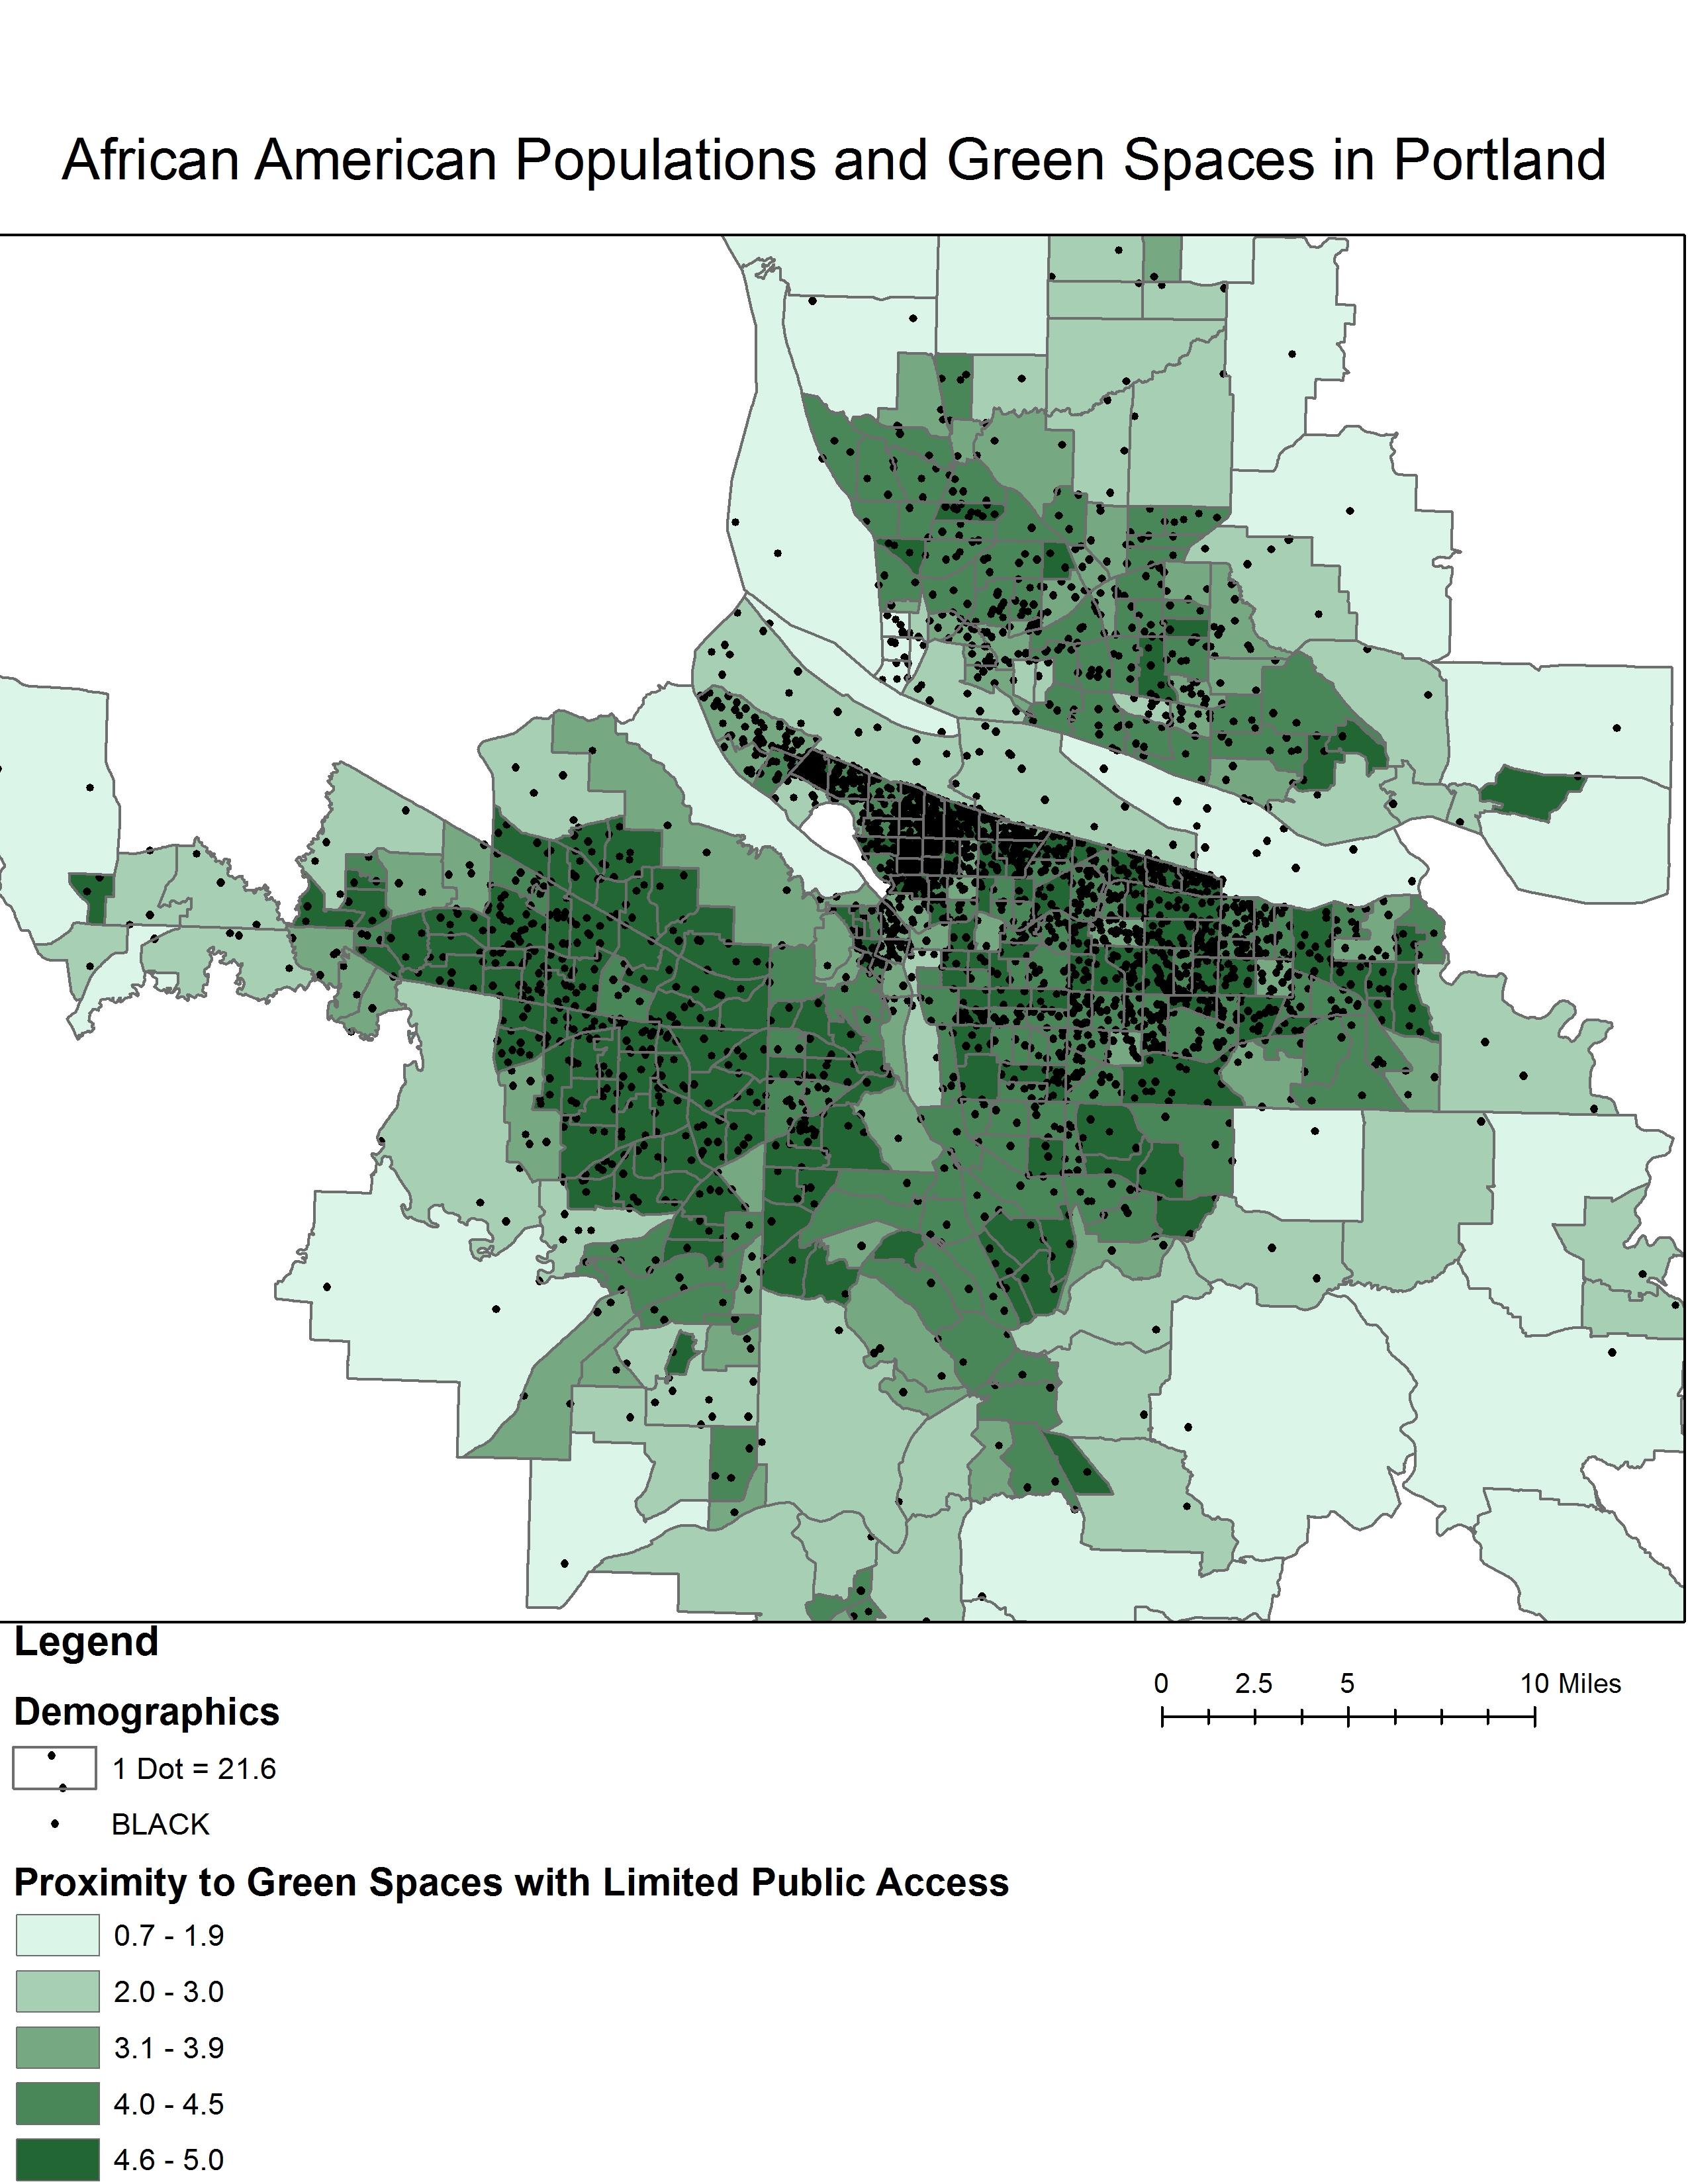
Figure 5: African American Population and Proximity to Green Spaces
Figure 5 shows a the majority of Portland’s African American population resides in northeast Portland in neighborhoods such as Piedmont and Woodlawn, areas with some green space access, but significantly less access than west Portland.

Figure 6: Urban Sprawl and Proximity to Green Spaces in Portland
The Urban Sprawl Index is a widely accepted index created by Smart Growth America, an organization that studies urban sprawl. The average index score is 100, with lowering scores representing sprawl. Figure 6 shows that the east of Portland is more compact and connected than the west and the outskirts. There is a clear trend between urban sprawl and proximity to green spaces in Portland. Neighborhoods on the periphery of the city have high urban sprawl and much lower access to green spaces. West Portland, the area with the highest green space access, has medium amounts urban sprawl. This relationship is also reflected in the statistics. There is a p value of 0, signifying a high correlation.
Figure 7: Statistical Analysis of Urban Sprawl and Proximity to Green Spaces