Geologic Analysis & Maps
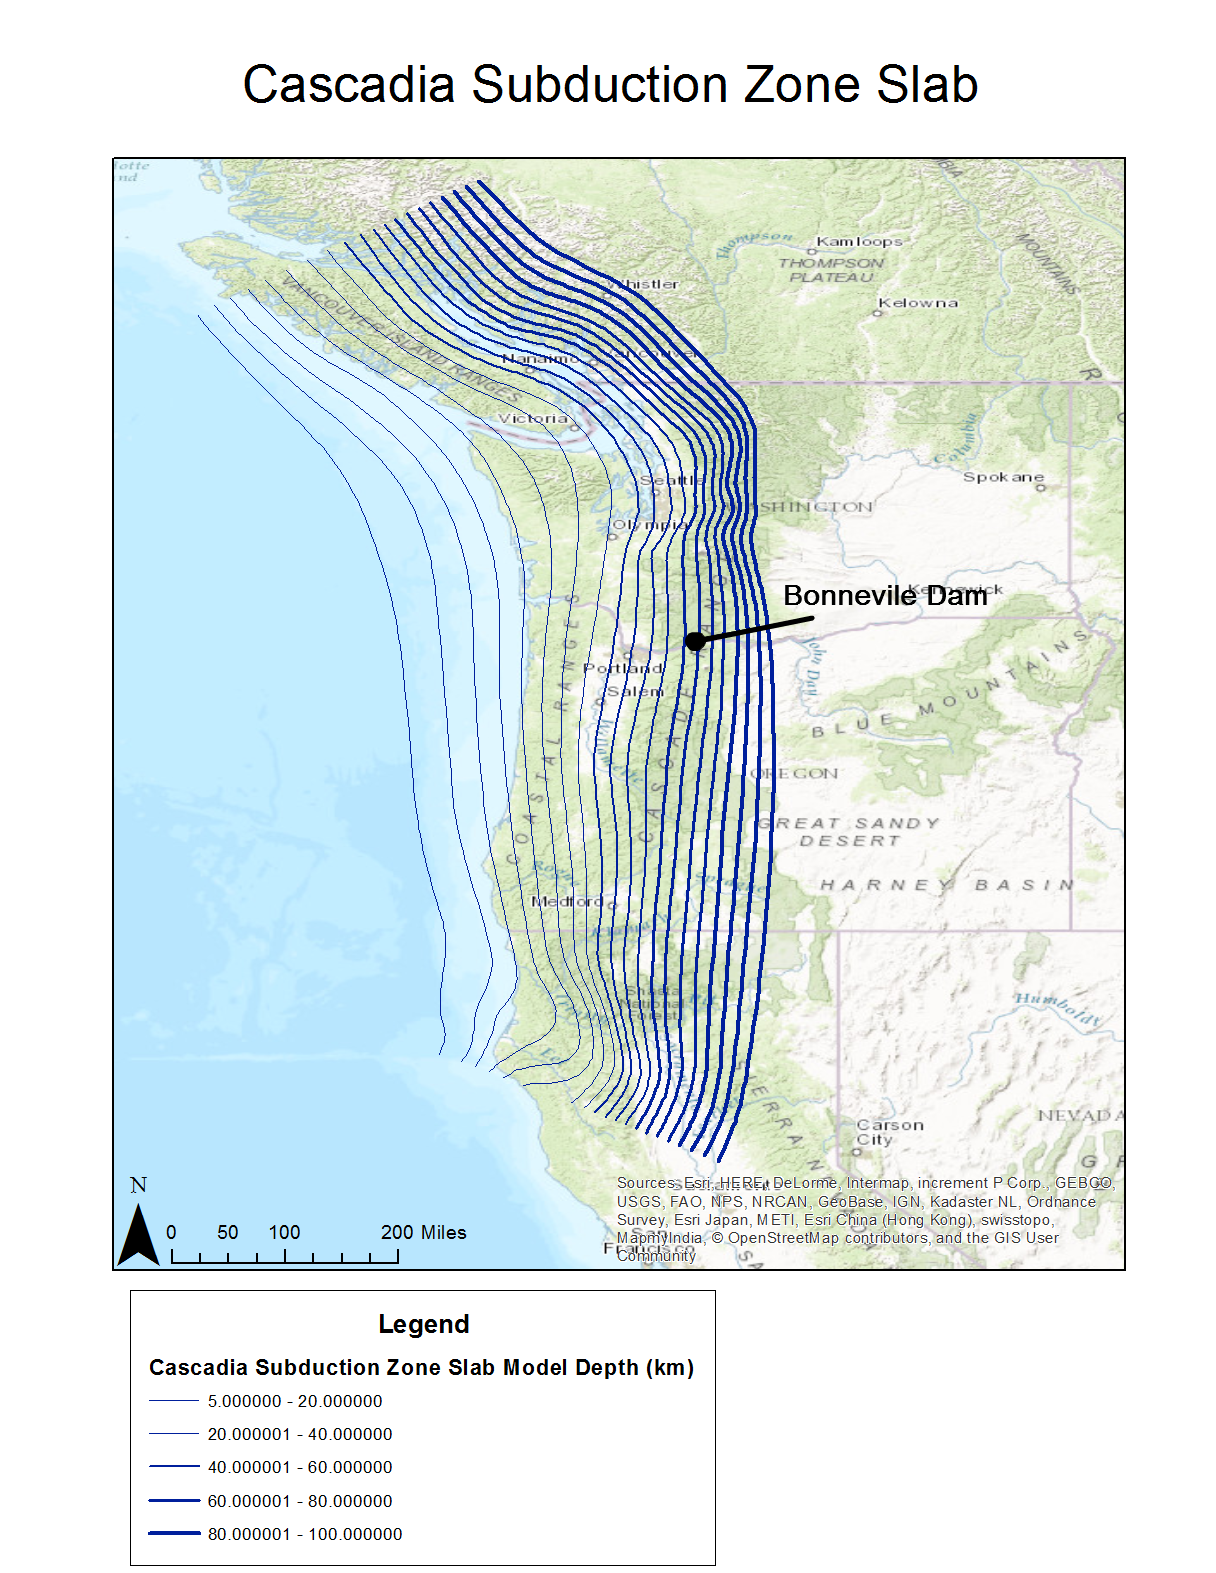 Figure 1: Cascadia Subduction Zone Depth
This map shows the slap of the Juan de Fuca plate as it subducts at increasing depth under the North American Plate. The depth of the subducting plate ranges from about 0-5 kilometers at the subduction zone offshore of the west coast to about 100 kilometers as the Juan de Fuca plate merges with the upper mantle of Earth. Large earthquakes (7.0-9.0 on the Richter scale) are possible throughout the entire subduction zone at each depth. However, depending on where precisely the hypocenter of the earthquake is across the three dimensions illustrated in this map, the implications for Bonneville Dam and other structures and regions vary widely. From our preliminary research, the locations in the zone that are most likely to slip next are along the shallower part of the subduction offshore.
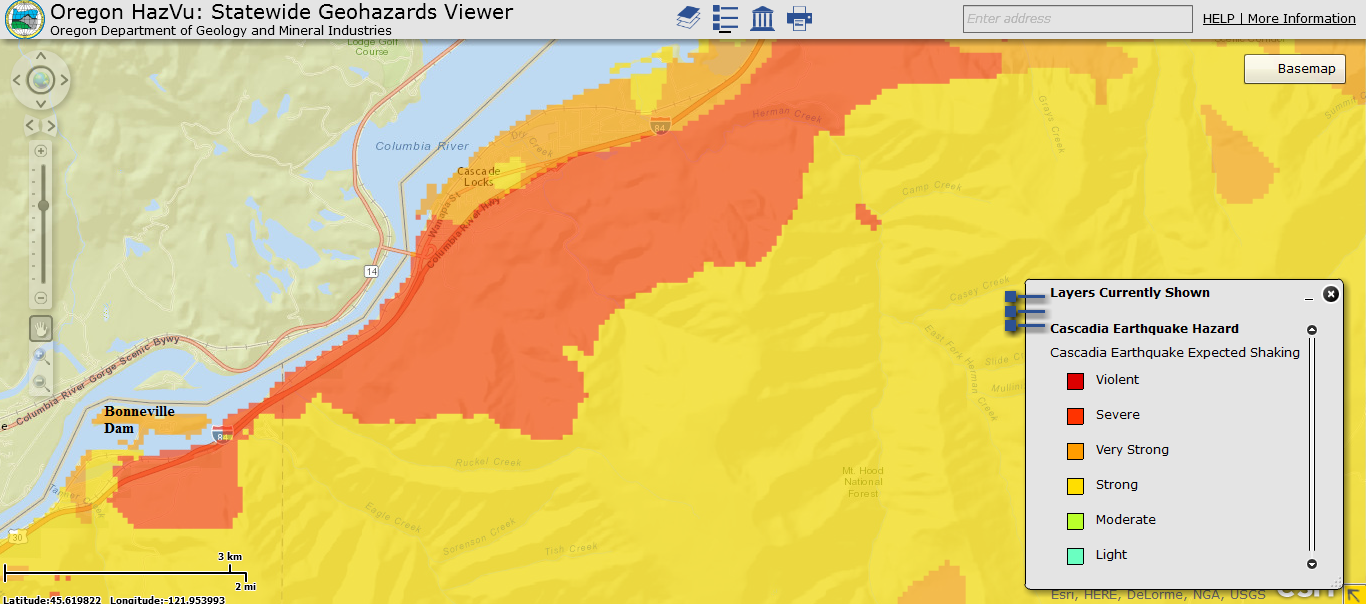 Figure 2: Oregon Cascadia Expected Shaking
This map shows the expected shaking of the area surrounding the Bonneville Dam in the scenario of a 9.0 Cascadia event. Directly to the south of the dam on the Oregon side, the slope as a rating of “severe” shaking, as does a large swath of the slope just upstream from the dam. Although the Oregon data does not explain the specific force behind the shaking ratings, the stronger the shaking indicates the higher probability of structural damage. Bradford Island itself, where the Bonneville Lock & Dam visitor center is located along with other structural aspects of the locks, dam, hydropower, and fish ladder systems, is predicted to have “very strong” shaking.
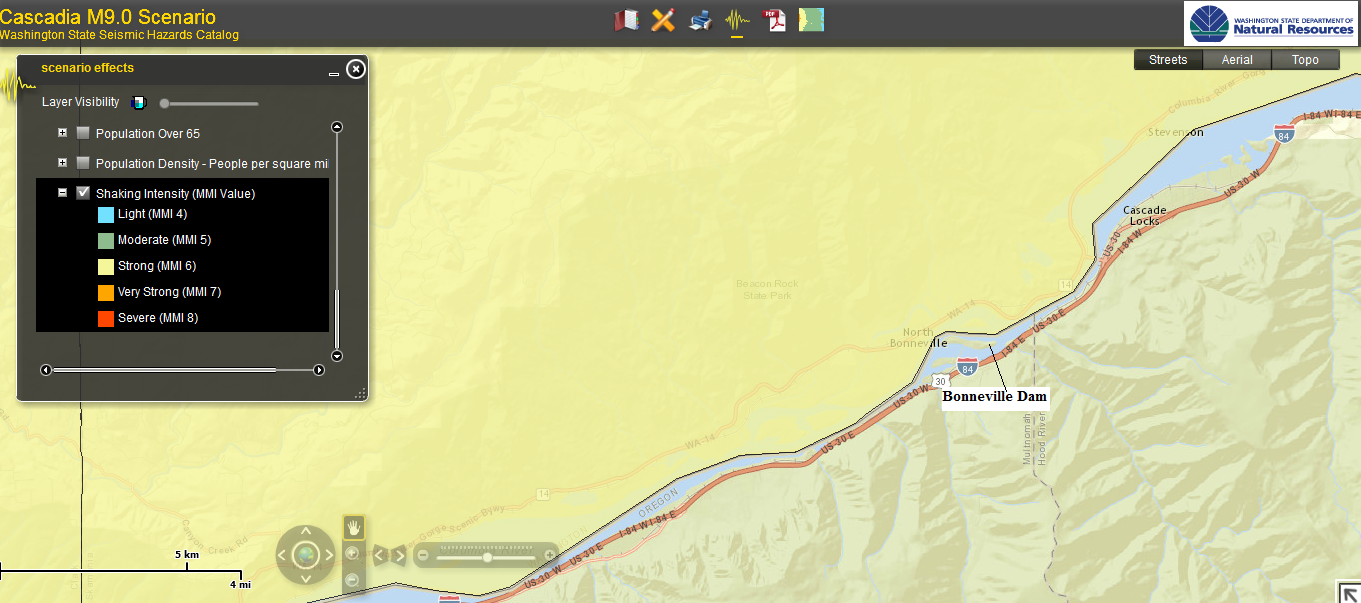 Figure 3: Washington Cascadia Expected Shaking
All along the Washington side of the Columbia River adjacent to the Bonneville Dam, the shaking is predicted to be “strong” or about 6 on the Modified Mercalli Intensity (MMI) scale. The Modified Mercalli Intensity (MMI) scale is a seismic scale that measures the effects of an earthquake on the earth’s surface, humans in the area, objects, and structures. The scale ranges from 1 (not felt) to 12 (total destruction). The description of MMI 6, derived by the Washington State hazard view map from the Association of Bay Area Governments Resilience Program, is the following: “Objects fall. Felt by all. People walk unsteadily. Many frightened. Windows crack. Dishes, glassware, knickknacks, and books fall off shelves. Pictures off walls. Furniture moved or overturned. Weak plaster, adobe buildings, and some poorly built masonry buildings cracked. Trees and bushes shake visibly.” While this is considered strong and a threat to structures, the shaking by itself does not pose a serious threat to the concrete structure of the dam. However, it would affect people in the vicinity and other buildings and structures nearby to varying degrees.
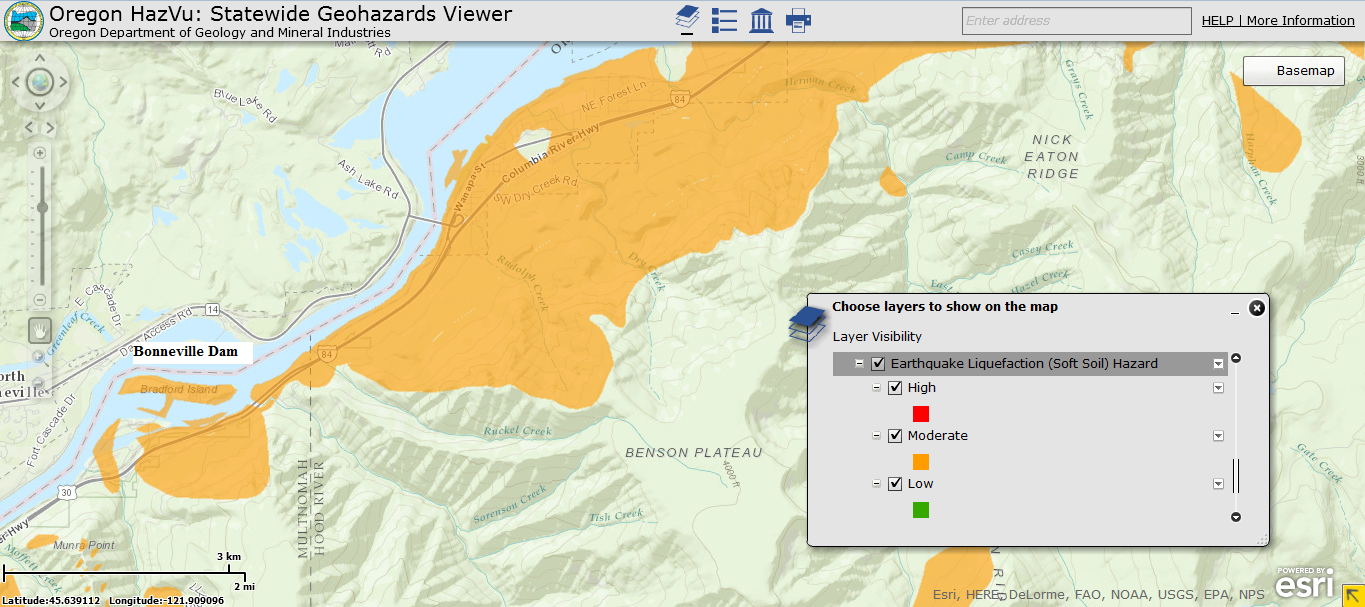 Figure 4: Oregon Liquefaction (soft soil) Susceptibility
Liquefaction, the event of loosely packed and moist sediments act as a liquid substance, can occur during the intense shaking of an earthquake. The liquefaction hazard for the area adjacent to the Bonneville Dam on the Oregon side as well as on Bradford Island is moderate. Buildings and infrastructure, such as the visitors center, are sitting on these soft soils and are likely to be severely damaged in an earthquake if liquefaction does occur.
 Figure 5: Washington Liquefaction Susceptibility
On the Washington side and according to the Washington scale, the liquefaction susceptibility of the area just downstream of the dam is high whereas the Bridge of the Gods area upstream of the dam is rated moderate. Both of these ratings indicate that the land on other side of the Bonneville is susceptible to liquefaction due to its looseness and moisture content.
 Figure 6: Oregon Landslide Susceptibility
This layer (originating here) was created to identify areas in Oregon where landslides might occur in the future. The data depicts landslide susceptibility at a 10 meter resolution and used the Oregon Lidar Consortium and USGS NED to map elevation. This elevation data was converted into slopes, and a multi pronged analysis process used these slopes, geology and mapped existing landslides. The banks of the Columbia River on the Oregon side are rated as “very high” for landslide susceptibility because landslides already exists on these steep slopes. Bradford Island and the outer areas of the Bonneville Lock and Dam property have moderate and high susceptibility, meaning that landsliding is likely or possible throughout the entire complex.
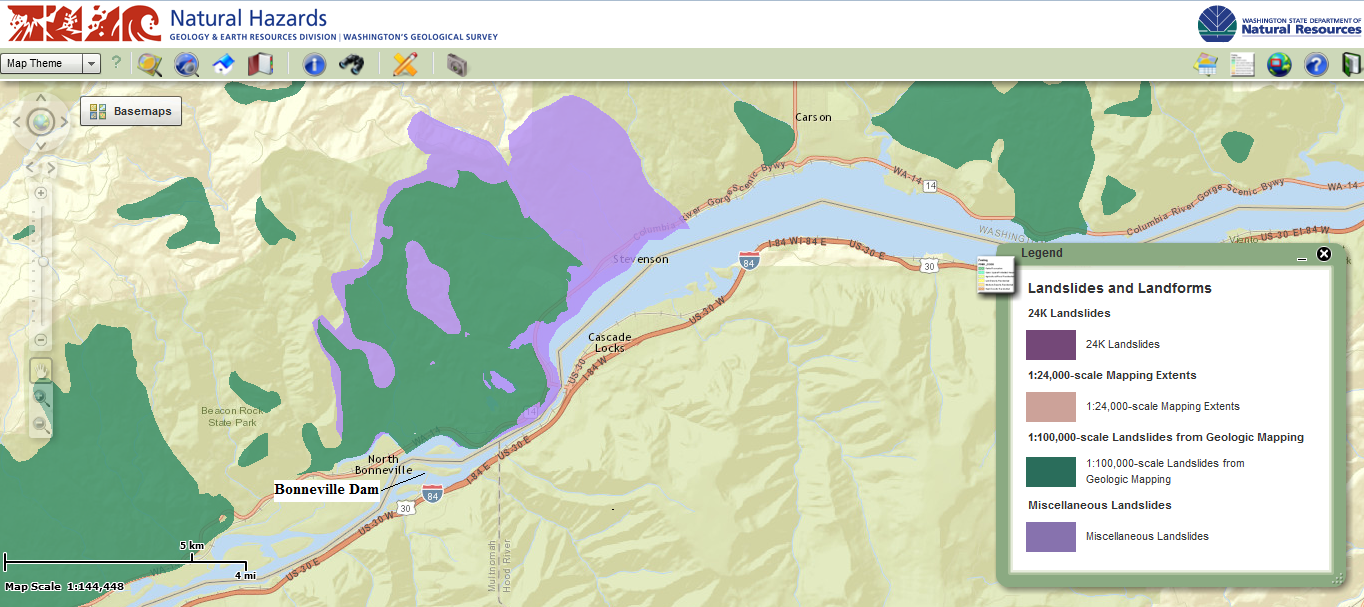 Figure 7: Washington Landslide Map
On the Washington side of the river, two landslide features dominate the area adjacent to the Bonneville Dam. The green shape is a collection of mass-wasting deposits, mostly landslides, from the current geologic period (Quarternary). The purple shape is the Bonneville Landslide, a deep-seated historic landslide that is currently being researched by the Washington Division of Geology and Earth Resources. Both of these preexisting landslides are areas of liquefaction susceptibility, and if they are measured in the same or similar way that Oregon landslides are, it’s likely that they would be rated “very high” in earthquake susceptibility.
Event Trees (Chain-of-events analysis)
 Figure 8: Event Tree for the recreation of Bonneville Dam
Recreation around the dam consists of water activities, hiking, and the the dam as a tourist attraction. Because of this, many post-earthquake effects can damage and hinder recreation, so we decided to focus on the potential for a landslide. The first “decisions” that happen in this tree are whether the landslide happens or not and whether it harms Bonneville recreation or not. While recreation can still be damage without a landslide, we are assuming that a landslide happened and damaged recreational areas for the parameters of this tree. Bonneville has a series of assessments their emergency team can do immediately, and it is most likely that the dam will close all recreational areas. In order to fix the damage, Bonneville dam then applies for emergency federal funding.
 Figure 9: Event Tree for the hydropower of Bonneville Dam
If damage is found to the economic and infrastructure risk assessment, Bonneville will shut off the turbines. If risk is found in the public safety risk assessment, Bonneville’s team will shut down the visitor center, gates, and travelling opportunities. In the case of hydropower, Bonneville would dispatch the Emergency Management Agency and the EMA would do their own assessment on the dam. After the results of this assessment and if there is damage and risk found in the dam, Bonneville would again apply for emergency federal funding. This map regards only the internal turbine hydropower infrastructure and not the external infrastructure of powerlines transmitting hydropower away from the dam.
 Figure 10: Event Tree for fish of the Bonneville Dam
As with hydropower, Bonneville would do a economic and infrastructure risk assessment. Their second assessment, however, would specifically look at damage to the fish ladders, elevators, and rigging systems. Again, Bonneville would dispatch the EMA who would do their own assessment. Like the recreation and hydropower event trees, Bonneville would apply for emergency federal funding in order to fix the damage caused by the earthquake.
For a simplified version of these event trees, used on our poster presentation, see here.
Summary of Interviews
Our interview with Amy Echols helped us, not only with our event trees, but also in understanding more about how the dam is run and operated. Amy revealed to us that she thought of the Bonneville dam as “an icon that represents development in the PNW and a leader in allowing for development and providing energy in a smart way”. She told us that the Bonneville is constantly changing, and that they are always trying to improve with the little money that is available. She spent a good part of her interview making it clear that Bonneville is always trying to make the dam safer for the fish that pass through it. Although the Bonneville may seem huge in size and symbolism, Amy grounded us by placing it in comparison with every other dam and large infrastructure in the world. She made it clear that the dam would be low on a long list of priorities if aspects of it were to fail due to an earthquake or any other natural disaster.