Myles Bridgewater-Jackman, AnaCapri Mauro, Kara Scherer
ENVS 220 fall 2014
Comparing Biodiversity to Country Size and Forest Cover Around the World
Background
The main variable we focused on was the GEF (Global Environmental Facility) benefits index for biodiversity, which compiles information about species, their threat status, and various habitat types in 183 different countries. This index basically represents the biodiversity of each country. Although the immediate loss of biodiversity is “likely biological, the ultimate causes are likely social, economic, and political” (Forester et al. 1996). According to Pereira et al. in 2010, “the strongest pressures on biodiversity are in developing regions.” Goklany specifically cites agriculture as a likely culprit of biodiversity loss, an evil that will continue due to the rapidly growing nature of the human population (Goklanny 1998). Several studies have been conducted to try and better understand the causes and relationships among habitats that may be experiencing a decrease in biodiversity. The Therriault and Kolasa study explored stressors on artificial rock pools in Jamaica that mimic those that naturally occur there and ultimately found a causal relationship between “physical stress, habitat heterogeneity, and biodiversity” (Therriault and Kolasa 2000). Chapter 5 from The Impact of Global Warming on Texas discussed how global warming could affect biodiversity, but in order to do so the authors defined biodiversity pointing to ecoregions, number of native species in an ecoregion and a species’ genetic variation as defining limits to biodiversity (Packard et al 2011). Forester and Machlis looked into the driving human factors for biodiversity loss, exploring how root causes could cause the over exploitation of biological resources and ultimately the extinction of a species (Forester and Machlis 1996). Biodiversity provides many important ecosystem functions and supports over 1 billion people who live in poverty, so it is “critical for economic development and poverty alleviation” to maintain the health and diversity of ecosystems (Turner et al 2007).
Procedure
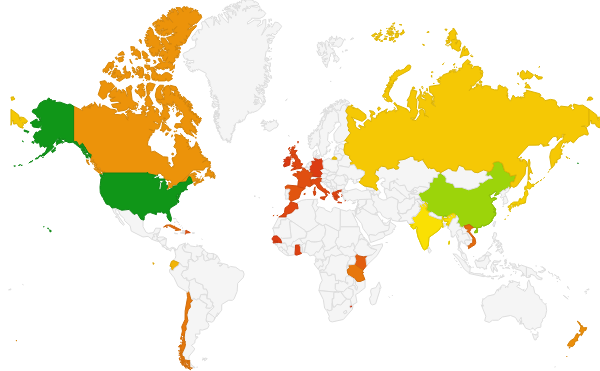
We began on the World Bank website to identify the variable we would choose to work with. After deciding on the GEF Biodiversity Index, we imported the values for each of the twenty-five 2014-2015 Lewis & Clark overseas programs. We then found literature relating to biodiversity that would enhance our understanding of our World Bank data. Using the percentrank function on our spreadsheet, we were able to rank each of our data points against our others with 1 (100%) being our highest point and 0 (0%) being the lowest. We used our original data from the GEF index and the country code to create a chart that would accurately and easily portray our data. In addition, we compiled a map that displayed this information.
After obtaining the data for our chosen variable, we used the data that other groups had gathered for two additional variables: Forest Area (percent of land) and Number of Threatened Plant Species. We created charts for each of these variables to compare them to our original variable.
Results
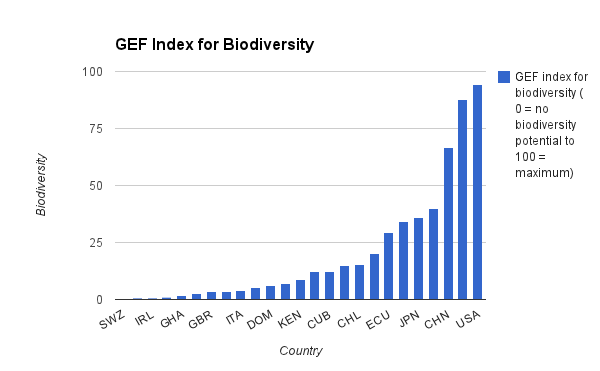
When comparing the GEF Biodiversity Index across the 2014-2015 overseas countries, it became clear that the countries with larger land mass consistently have a higher amount of biodiversity than smaller countries. The United States, Japan, India, China, and Australia make up the top quintile relative to the other countries and Swaziland, Senegal, Ireland, Ghana, and Germany compose the bottom quintile.
The second variable that we chose to look at, Forest Area (percent of land) shows that the larger countries also have a significant amount of forest. The smaller countries generally have fewer forests, with the exception of Japan. Vietnam, Senegal, Russia, Japan and the Dominican Republic create the top quintile, while the United Kingdom, Kenya, Morocco, Ireland, and Australia compose the bottom quintile relative to the other countries.
Our third variable, number of threatened plant species, displays Ecuador as having overwhelmingly more threatened plant species than any other country. The United States, Tanzania, India, Ecuador, and China are in the top quintile relative to the other countries, while the United Kingdom, Swaziland, Senegal, Russia, and Ireland create the bottom quintile.
Discussion
In The Impact of Global Warming on Texas, biodiversity “refers to (1) the number of types of natural ecological regions (ecoregions), (2) the number of native species within each ecoregion, and (3) the genetic variation within species” (124). We found it interesting that many countries that topped the charts in biodiversity were not necessarily situated in Central and South America–areas known for their luscious rainforests and exotic animals. In the aforementioned book chapter, the authors explained that the size of an area can have as much influence on biodiversity as the type of climate encompassed within the area. “Texas is ranked second only to California in overall estimates of biodiversity [in the United States],” and much of the biodiversity can be attributed to large variety of ecoregions within the state. Texas contains twelve major ecoregions, “ranging from deserts to prairies and pine forests from mountains to coastal marshes” (124).
Applying this to our data, we discovered that a majority of the countries with the highest ranking biodiversity were the larger countries of the world. Although we didn’t research how many recognized ecoregions were contained within each country, we assumed that, like Texas, more square mileage might have translated to more ecoregions contained within a country and thus more biodiversity.
As stated earlier, biodiversity is not one dimensional. Just because a country is large does not make it naturally biodiverse, and vise versa. For the countries that were not expansive, we examined other possible contributors to their lack or plethora of biodiversity. Japan was a country that we examined that, unlike other small countries, was relatively biodiverse. Our group decided to examine “percent of land forest area” and came to find that Japan had the highest percentage of their country as forest, at 69%.
Another factor that we noticed largely affected the biodiversity of a country was the regional temperature of that country. The chapter from The Impact of Global Warming on Texas, stated “vertebrate species richness naturally tends to be highest in southern areas and decreases with seasonally harsh winters in the north” (Packard et al 2011).
Applying that to our world map, we noticed that this played a role especially in Russia. Russia, a large country with a higher density of forest area, might be assumed to be one of the most biodiverse countries. However, due to the location of the country, Russia annually experiences harsh winters through a majority of the country, hurting its net biodiversity.
Adversely, we also noticed that temperature had a positive effect on biodiversity in Australia. Australia was exceedingly low in forest percentage yet is a relatively larger country. However, when examining the net GEF biodiversity, Australia is only second to the US. This catapult into “second place” could be attributed to its temperate climate and its mild winters. Due to the fact that vertebrates would have less seasonal adversity testing their toughness, even the more vulnerable plants and animals would have opportunity to survive throughout the winter and prolong the existence of their species.
Overall, we found very interesting connections between biodiversity and size, forest cover, and temperature. However, the World Bank website does not give very detailed descriptions as to how the GEF Biodiversity index data is collected, so it’s difficult to determine the validity and precision of the data that was provided. Additionally, since the data sets span entire countries, there is not a standardized area that is being surveyed. Biodiversity encompasses many different criteria, so although the numbers might stay the same, individual aspects of the index might vary. An interesting follow-up to our research might be a more detailed look at biodiversity throughout the world, not just the twenty-five countries that Lewis & Clark students study abroad in. For example, it would be interesting to continue our research on how the size of a country corresponds to biodiversity by looking at other large countries such as Canada.
Bibliography