Background
Social network analysis is an important tool that helps find connections between people, ideas, or books, to name a few. In such an interdisciplinary major as environmental studies, it is important to find connections between all the different topics we examine. This lab analyzes the network of citations between thirty-six different environmental classics, as found on the GoodReads best environmental books list as well as Powell’s employee picks list for the environment.
Procedure
After choosing an environmental classic from either GoodReads or Powell’s, we ran a quick search on GoogleScholar to determine how many citations that particular book had. If the book had over one hundred citations, we added it to a shared spreadsheet on GoogleDrive. That spreadsheet had two tabs, nodes and edges. The nodes spreadsheet had the thirty-six classics at the top, followed by the top ten citations for each respective classic that we found on GoogleScholar. During this stage, we were very careful to avoid duplicates, so each classic doesn’t necessarily have ten citations because some classics shared citations. We also had to verify information from each source by cross referencing the GoogleScholar result with Lewis & Clark’s library search engine, Primo. The edges sheet connected each citation with the environmental classic by listing the row numbers of each data point.
The nodes and edges spreadsheets were exported as CSV files into Excel, where we cleaned up any extraneous data. We then imported these spreadsheets into Gephi, where we simultaneously analyzed the data and figured out the most effective way to organize and present it. We manipulated the resulting visuals by changing the scale and gravity, adding labels, and weighting certain data points that were cited more than others. The resulting graph was a visual representation of the social network web of the citations from each environmental classic. From there, we analyzed the different patterns that we saw in Gephi and drew conclusions based off of those groupings.
Results
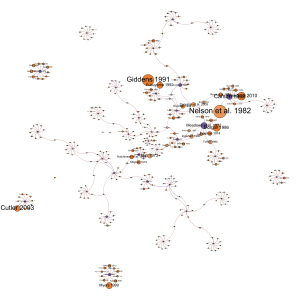
After running the data through Gephi and manipulating a few of the visuals, we produced a web-like graph which grouped references that

shared a classic environmental book source. We also performed some basic math functions to figure out how many results would be the typical range for a data analysis like this. We figured out that the minimum number of citations we could produce would probably be 36 or 37, while the maximum number of citations would be around 390. After all of the citations were entered, we had a total of 361 taking into account all of the overlapping citations.
My web, like many others, did not have very many clusters, signifying a diverse array of citations with only a few overlaps. The larger circles and text represent works that were cited by the other data points repeatedly, with more repetition resulting in a larger circle. The purple circles are environmental classics with over one hundred scholarly citations listed on GoogleScholar, while the orange circles are the citations that these classics used. This creates a flower shape, since there is one classic that used (at least) ten different sources. Due to the scale and gravity functions of Gephi, the clusters move together when they have more in common, resulting in little “hotspots” of citations.

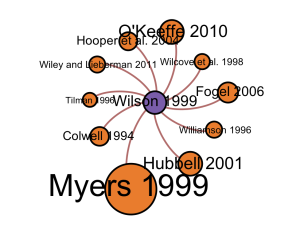
As seen in Figure 1, there are few clusters that aren’t connected to the main group at all. These clusters are not connected because they did not share any citations with the clusters in the main group. Some of the detached clusters have inflated circles though, which means that the other citations within that cluster must have cited that specific one, as seen in Figure 2.
Discussion
The environmental classics that we chose did not have as many overlapping citations as I expected. When we began this lab, I thought for sure everyone would be citing the main classical environmental theory papers that we read in ENVS 160, but as it turns out, that was not the case. There are a variety of possible explanations. For one, the environmental classics that we chose were from many different decades: they weren’t old dusty classics that had been around for decades, they were also new inspiring and innovative books from the past few years. Therefore, the older citations would not be able to use these new books as references because they had not yet been published. Additionally, we did not select a specific area of interest, so the books that we chose ranged from population analyses to novels about food. Although all “environmental,” all these books did not necessarily deal with the same facet of environmentalism.
The detached clusters that are present near the outskirts of the web are an interesting asset of these maps, because they illustrate the vast amount of material environmental studies deals with. There are small subsets of very important material that aren’t really at all connected to the main issues, but they are still very important and tend to cite each other (as seen in the enlarged circles). There were about five of these detached clusters, which really show how specific environmental studies can be. Many of the clusters in the main web were arranged by date, with publications ranging within ten years of each other. This might signify environmental “fads” or at least trends in what people believed to be the most pressing environmental issue of the time.
Overall, this lab helped us gain a very important skill in being able to illustrate the connections between various people, institutions, or topics. In environmental studies, we always talk about how interdisciplinary the program is. It is very interdisciplinary, but the really interesting part of taking such a diverse array of classes is the intersections, or nodes, that each discipline shares. Additionally, as we approach the proposals of our concentrations, it can help us sort out the intersections of many different resources that we have collected. Gephi definitely helps to create a concrete, visual model of a lot of complex information — just what we need in environmental studies!