By Myles Bridgewater-Jackman, AnaCapri Mauro, and Kara Scherer
Background
Riverview Natural Area, or RVNA, is a natural area in southwest Portland nestled between the Willamette River, Tryon State Natural Area, and Forest
Park. According to the city of Portland’s Parks and Recreation website, “It was logged in the 1800s and 1950s and was subjected to vegetative neglect over the next 60 years.” Like nearby Tryon, RVNA has been faced the issue of fighting invasive species from the area. There has been excessive invasive species removal done within the natural area, along with the planting of over 50,000 native trees and shrubs.
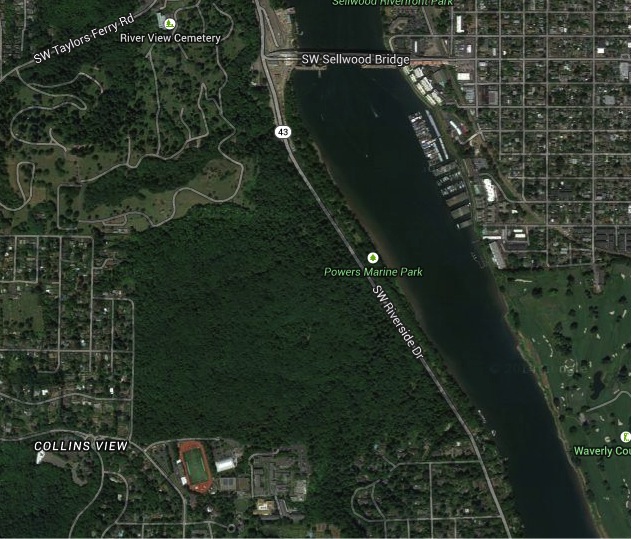
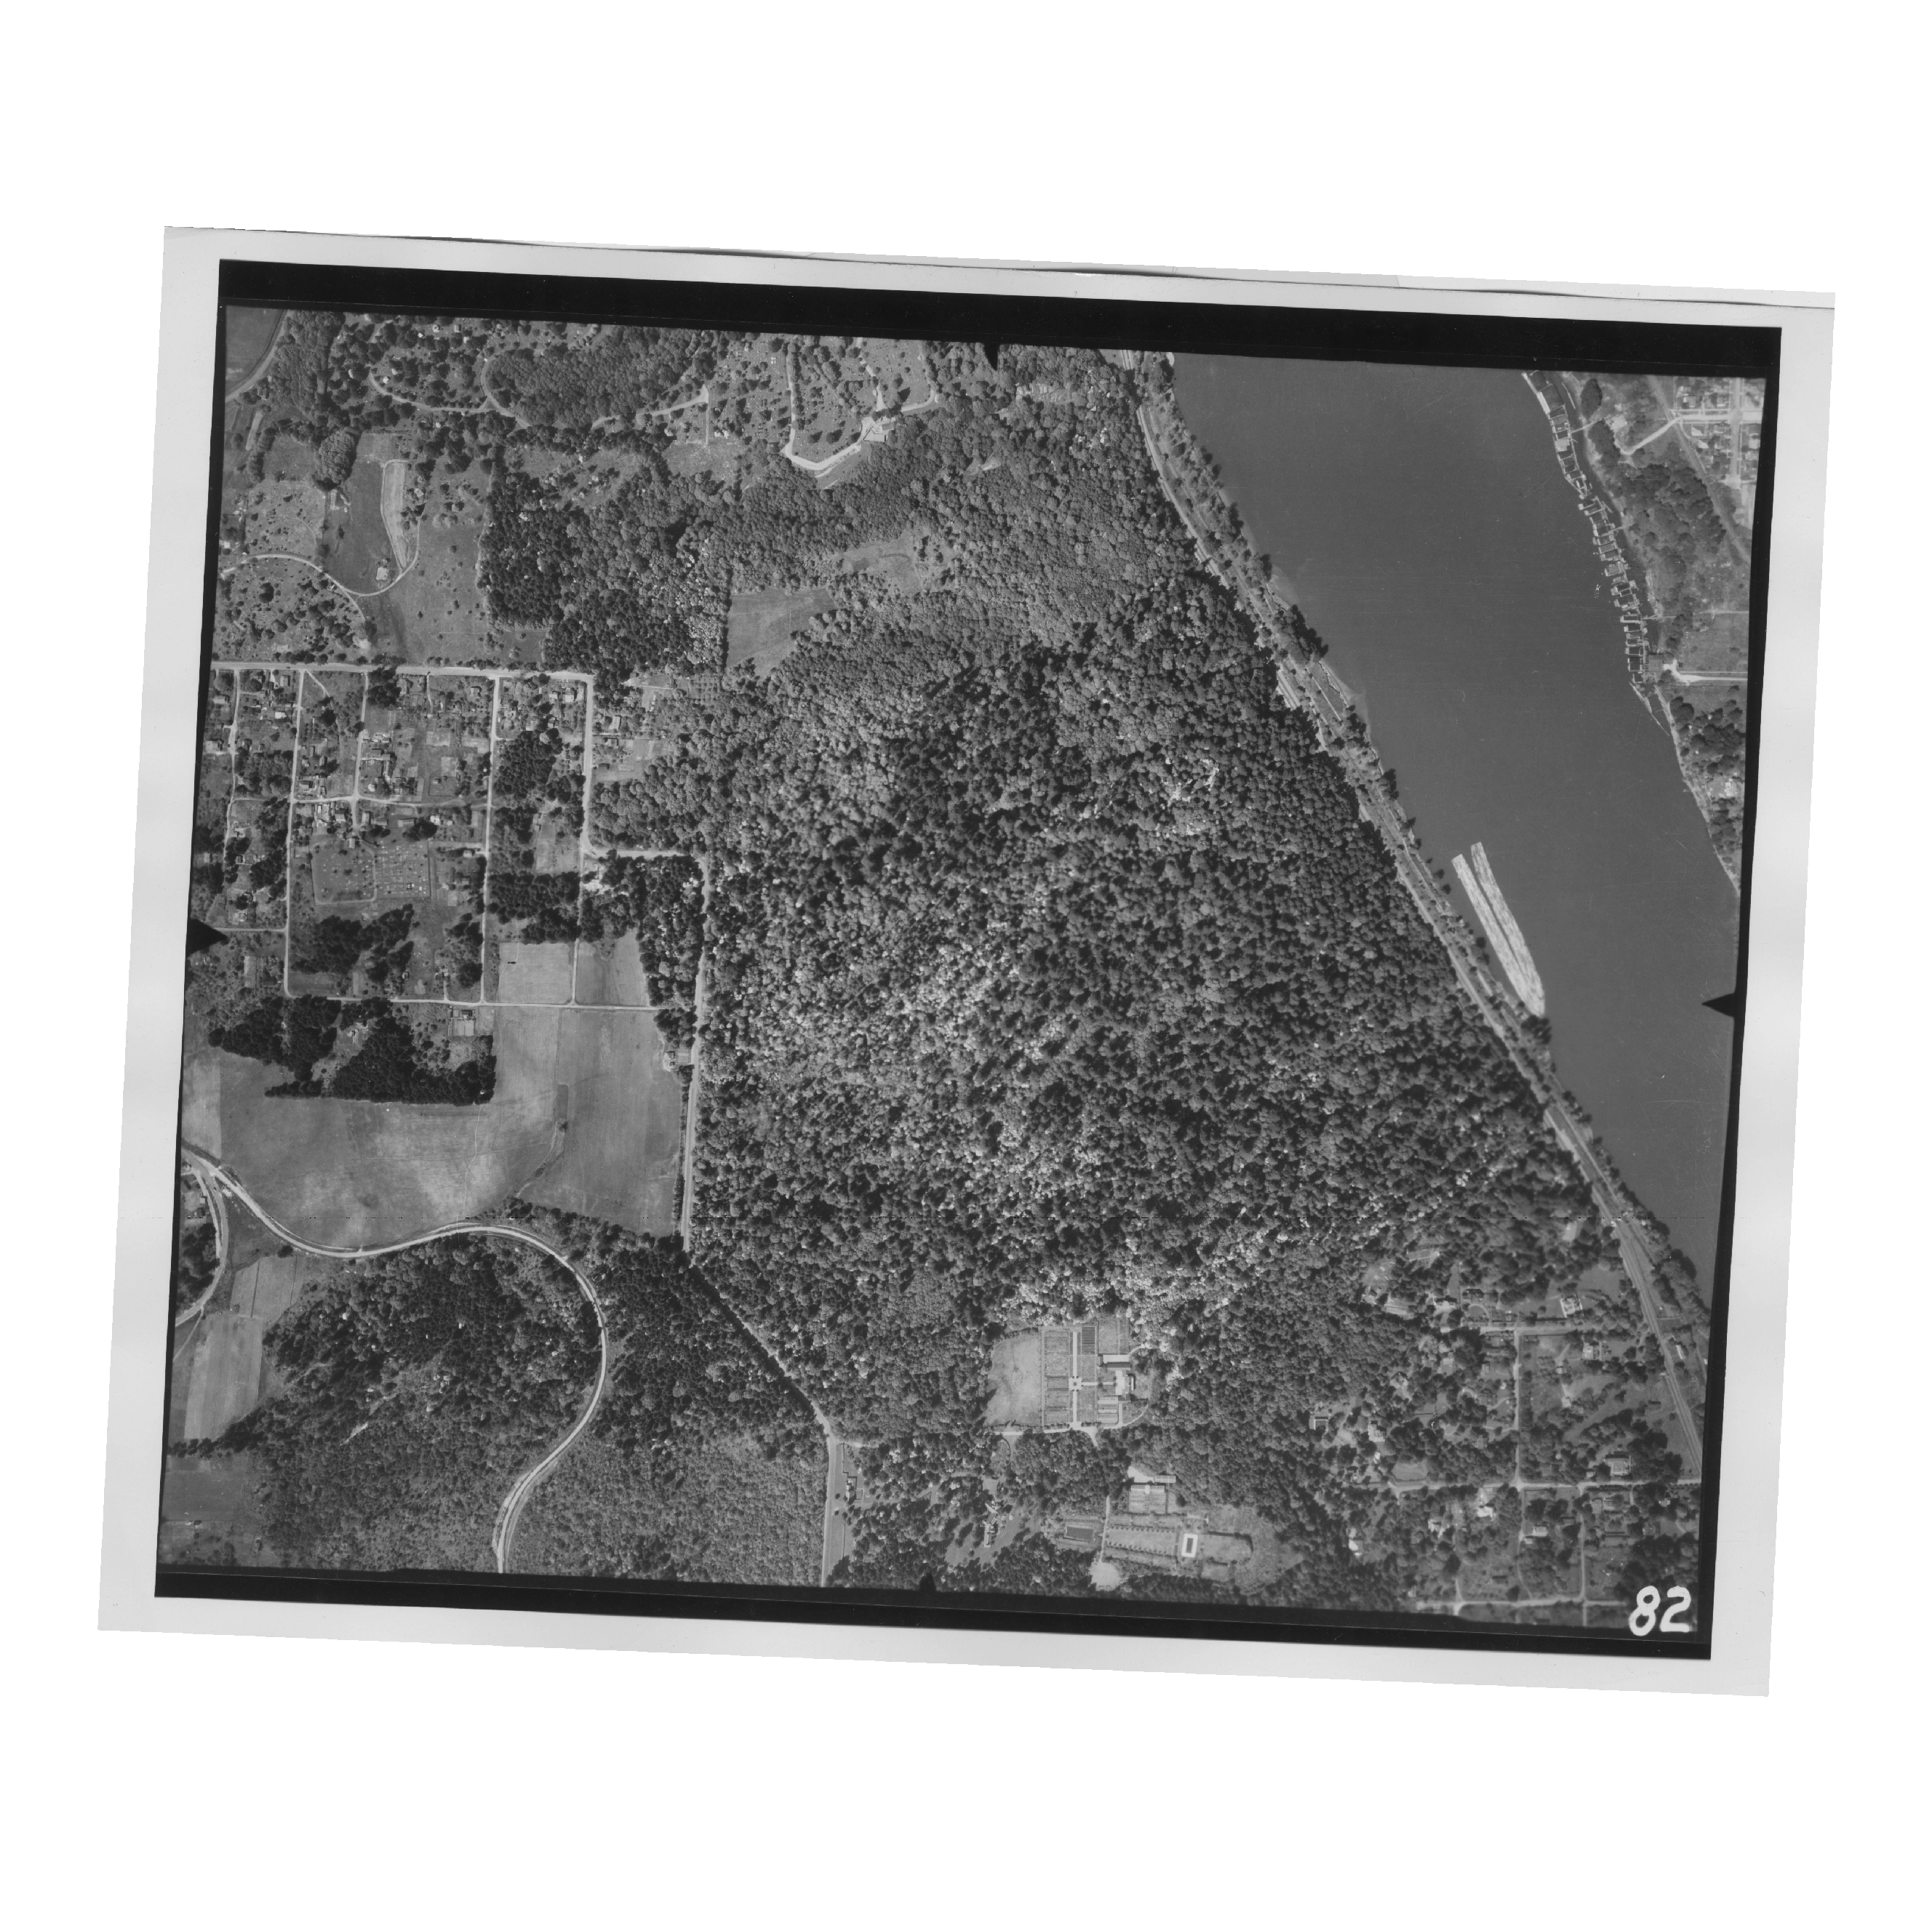
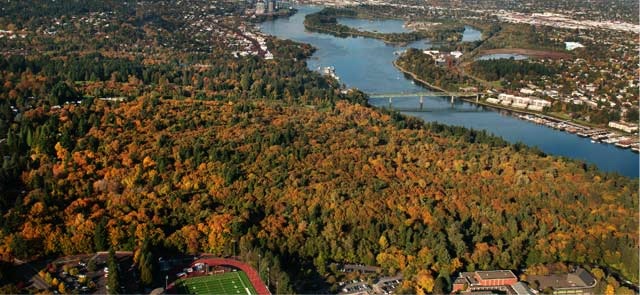
Comparing the two photos–the first from 1940 and the second an updated satellite picture from Google Earth–one may easily see that the density of RVNA has drastically increased in the last 74 years. Another comparison to make between the two ages is the amount of coniferous forest present compared to the amount of deciduous forest. Although the Google Earth picture makes it hard to distinguish between coniferous and deciduous–or green and green. The picture of RVNA in fall (below) taken from the Portland Parks and Recreation website, shows the incredible density of deciduous forest now present. The 1940 photo shows that the deciduous forest (darker trees) made up a smaller–yet still large–percentage of RVNA. Coniferous trees in 1940 took up a much larger percentage of RVNA and definitely had a section of the natural area dominated by this type of tree.
Procedure
Before going into the field, we familiarized ourselves with RVNA and its history, as well as the current species that serve as canopy cover. We practiced identifying Douglas fir, Grand fir, Western hemlock, Western redcedar, Bigleaf maple, Black cottonwood, and Red alder. In addition, we prepared to use the mobile devices (iPad Mini) to use both the Fulcrum and Flickr apps. After receiving our trail assignments, we set out as a team to record the current canopy cover of RVNA. Starting at the top of our trail, we walked approximately thirty meters (thirty long paces) where we would then stop and identify and count the trees in a five meter radius circle from the center of the trail. We recorded these species in the Fulcrum app, along with evidence ivy removal, current ivy cover (percentage), and current/historical canopy cover (percentage). After recording this information, we took a notable picture with a descriptive caption and continued to our next site, thirty meters down trail. We continued this process until we met up with the other team that had began at the other end of the trail. Each point that we stopped at had a unique record ID to distinguish it from each other point.
Back at the lab, we uploaded all of our pictures to Flickr and exported our Fulcrum trail data to the server where every group’s data would eventually end up to create a full picture of RVNA in the present day. After all group data was accounted for, we downloaded the Fulcrum app data as a .csv file which we cleaned up by deleting the irrelevant data, and opened it with QGIS. In GIS, we mapped different attributes to search for different trends to compare to the 1940 photo of Riverview Natural Area.
Results
Our results showed that most areas that were open in the historical survey had grown back and are now mostly covered. In this map, there are
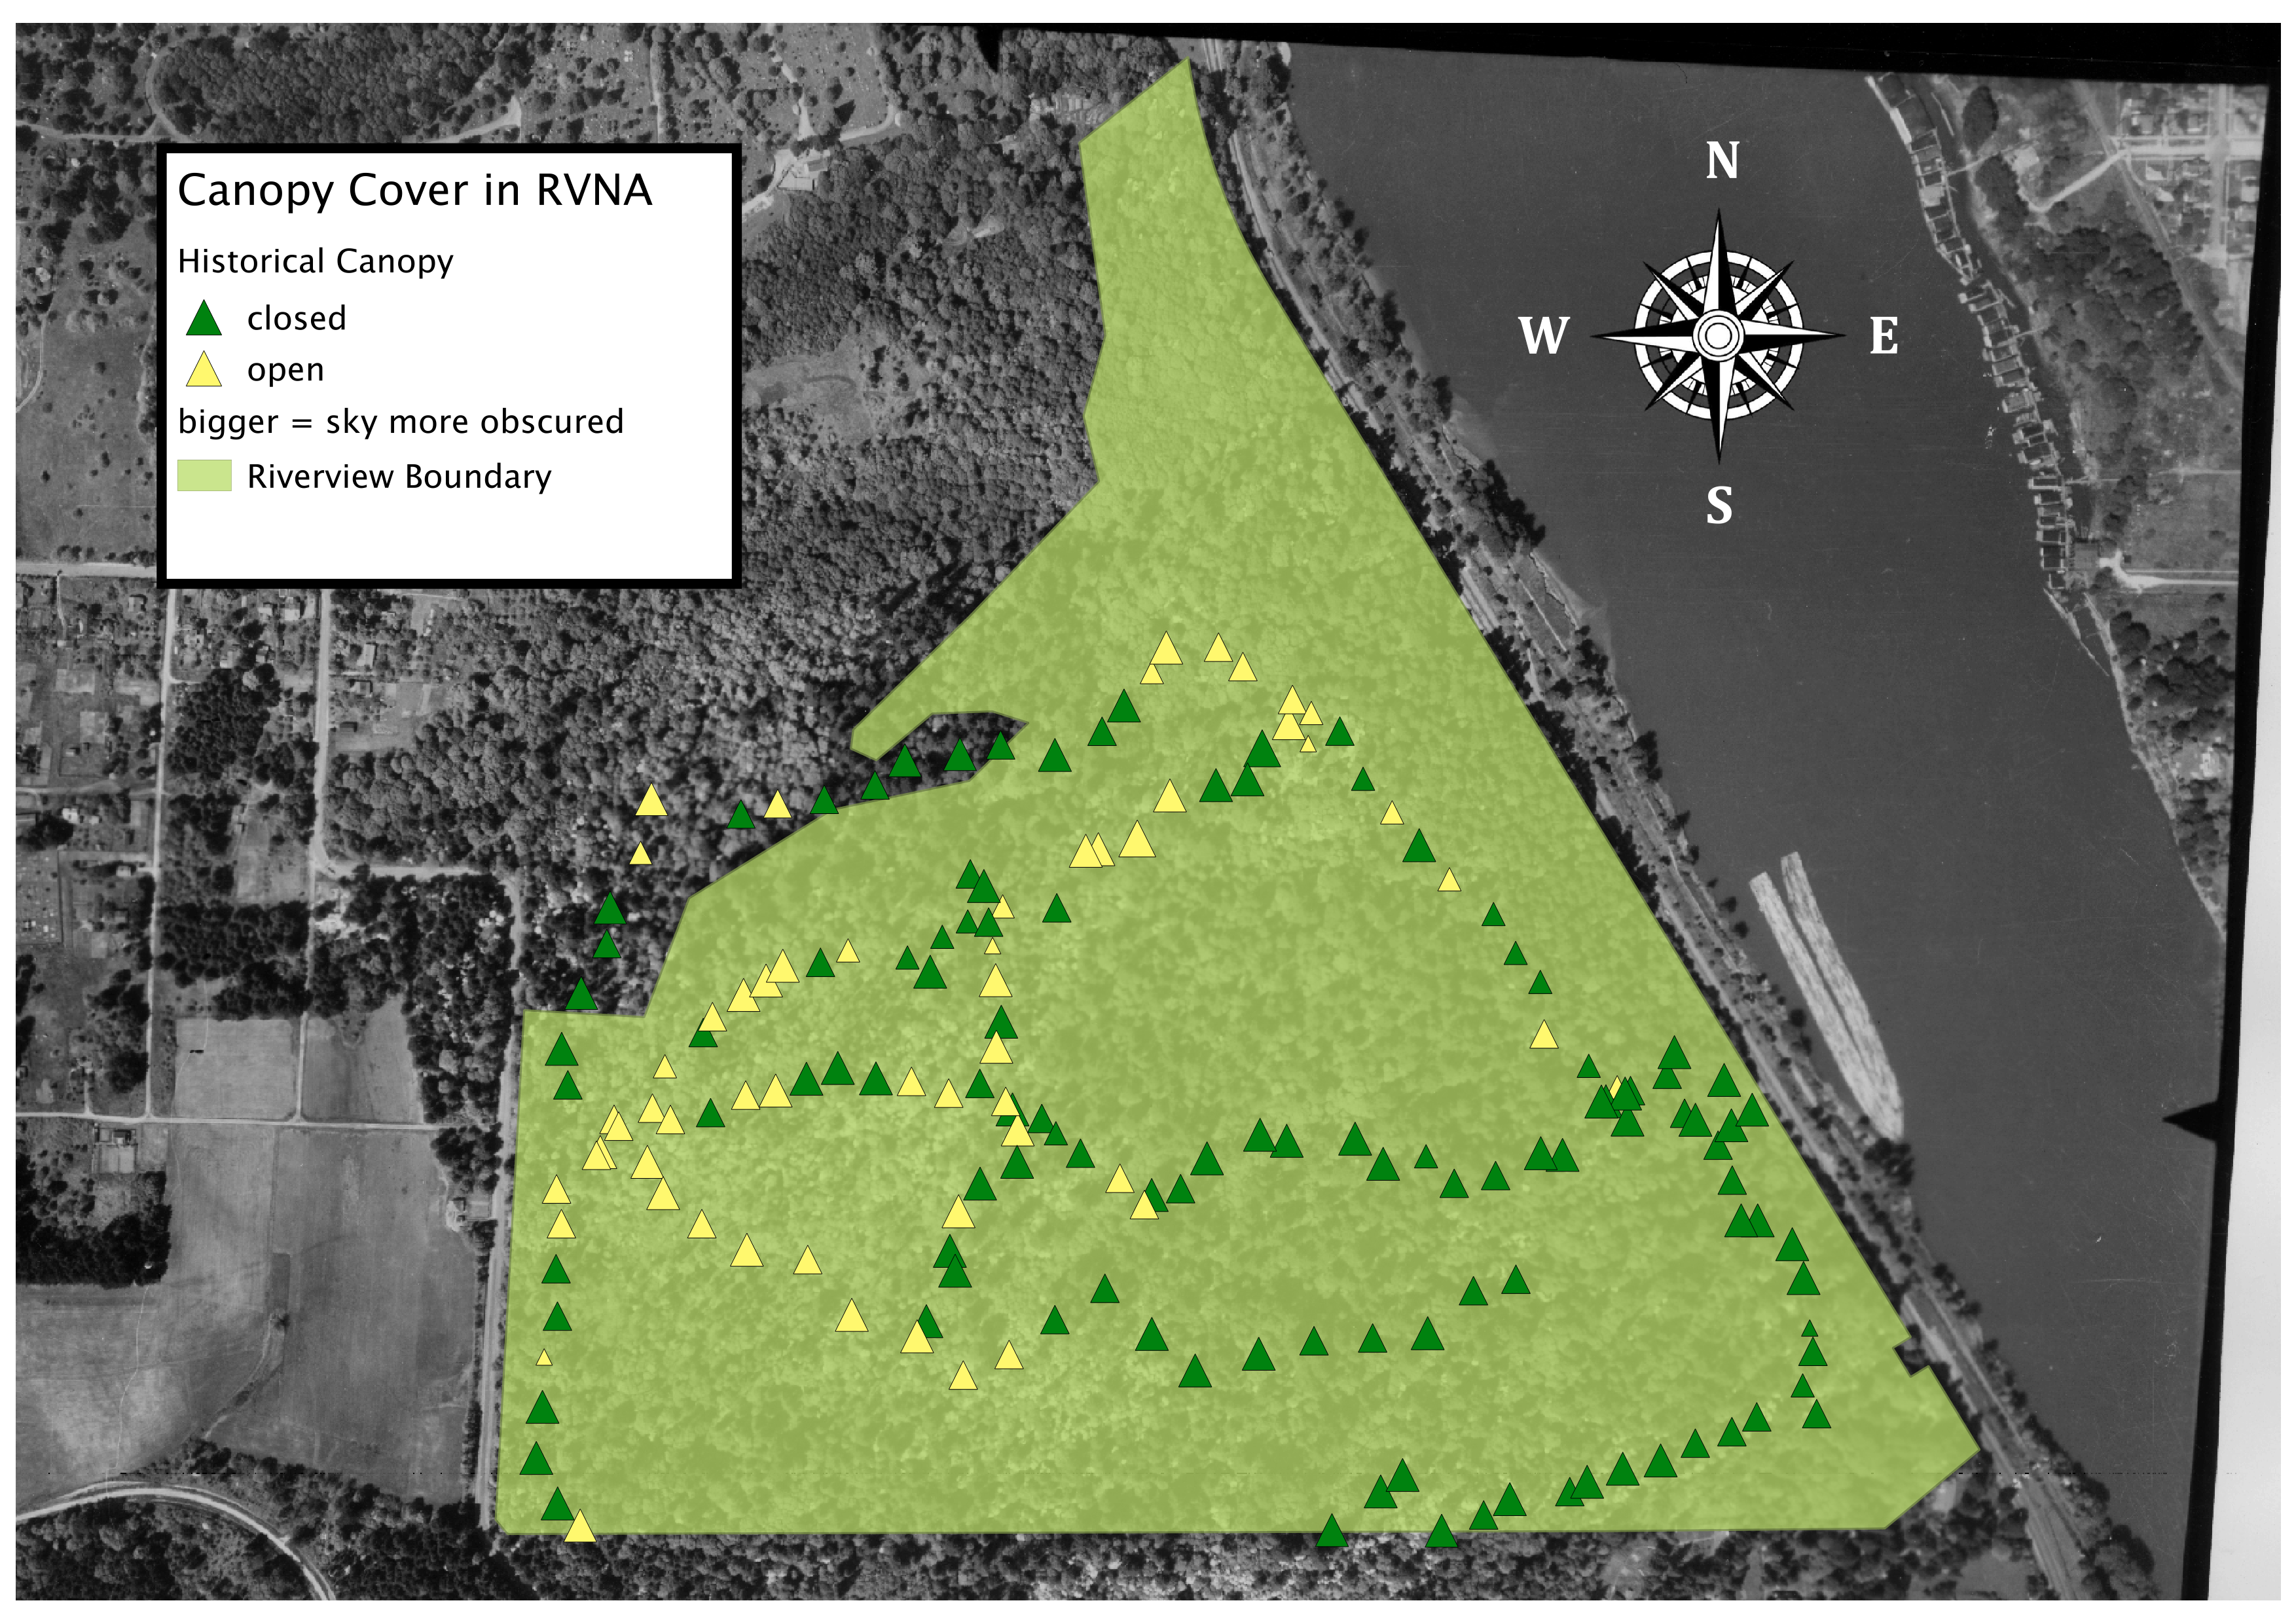
two variables being displayed: historical canopy coverage and current canopy coverage. The historical coverage is recorded by either being open or closed, color coded with yellow or green, respectively. The current canopy coverage is based on a five point scale, and is illustrated by size. The bigger the icon, the more dense the canopy cover in that area was.
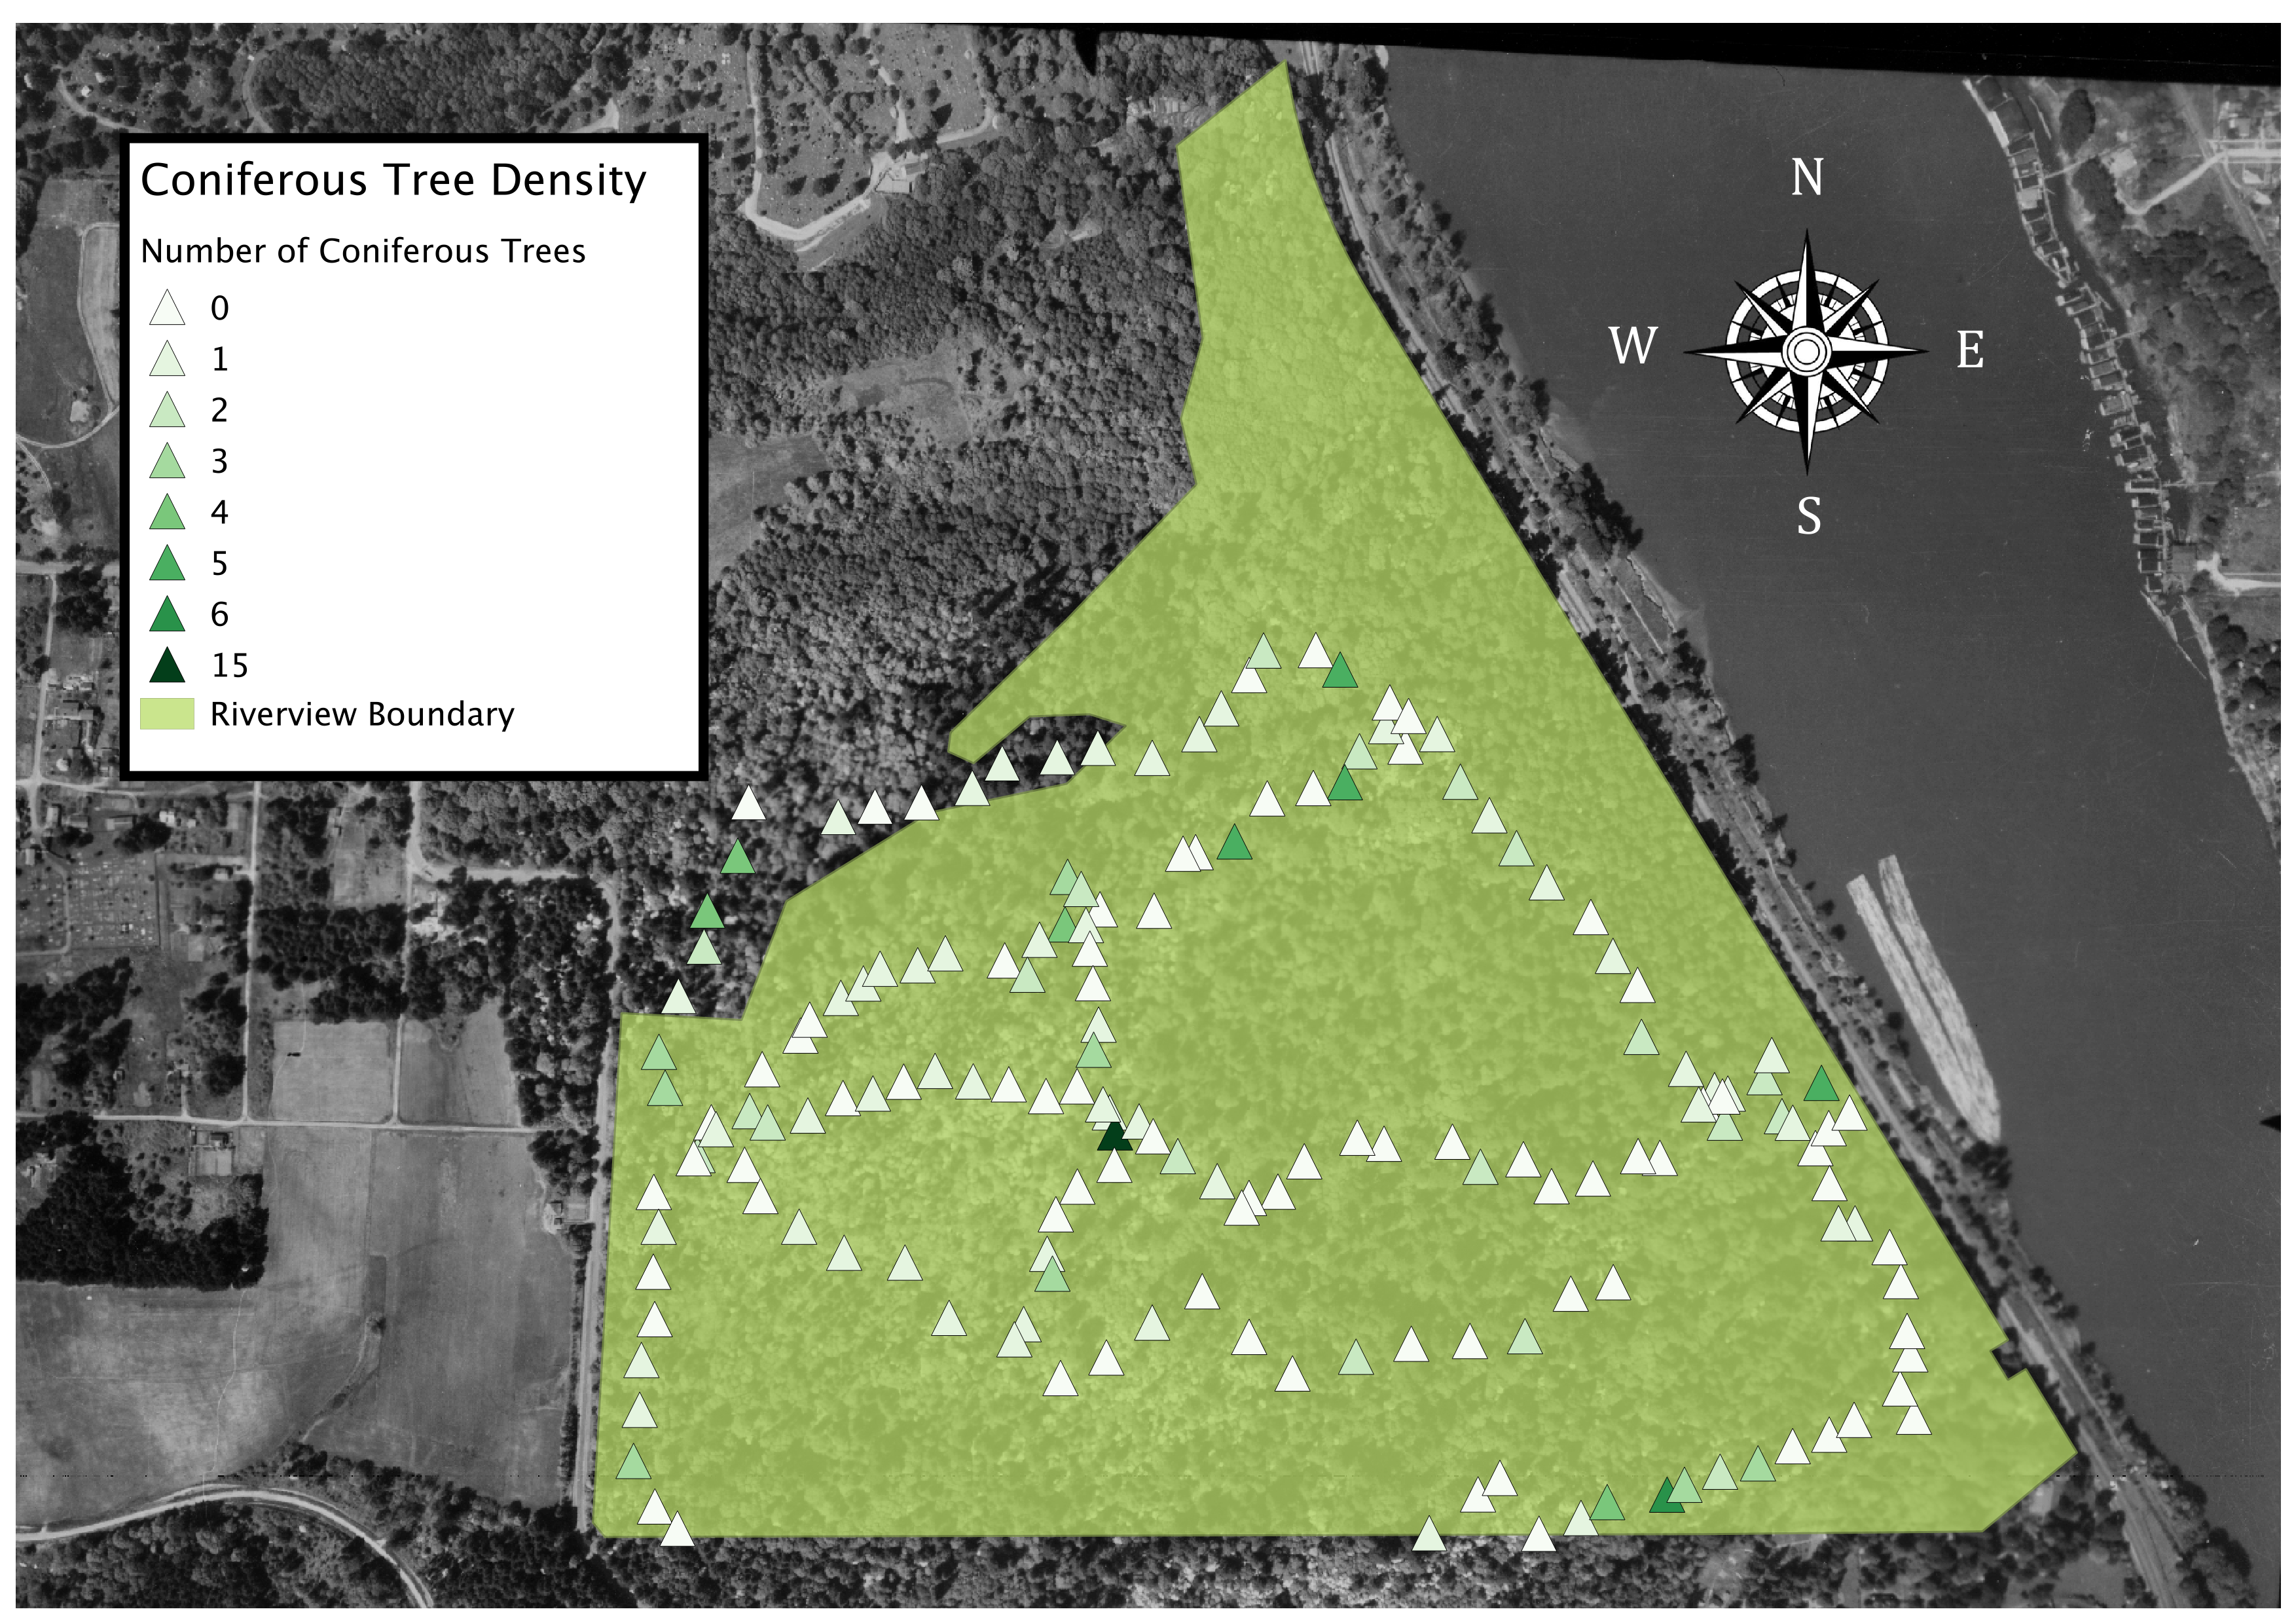
Our next map explores the density of coniferous trees per area we studied. We calculated this by adding together the numbers of different coniferous trees in each area (Douglas Fir, Grand Fir, Western Hemlock, and Western Red Cedar). This data was then mapped to display the density based off of color — the darker the icon, the more trees there were in the area. There is one plot that had an unusually large amount of trees (15) which is the darkest green icon on the map. Finally, we created a map that illustrates the density of deciduous trees in Riverview Natural Area.
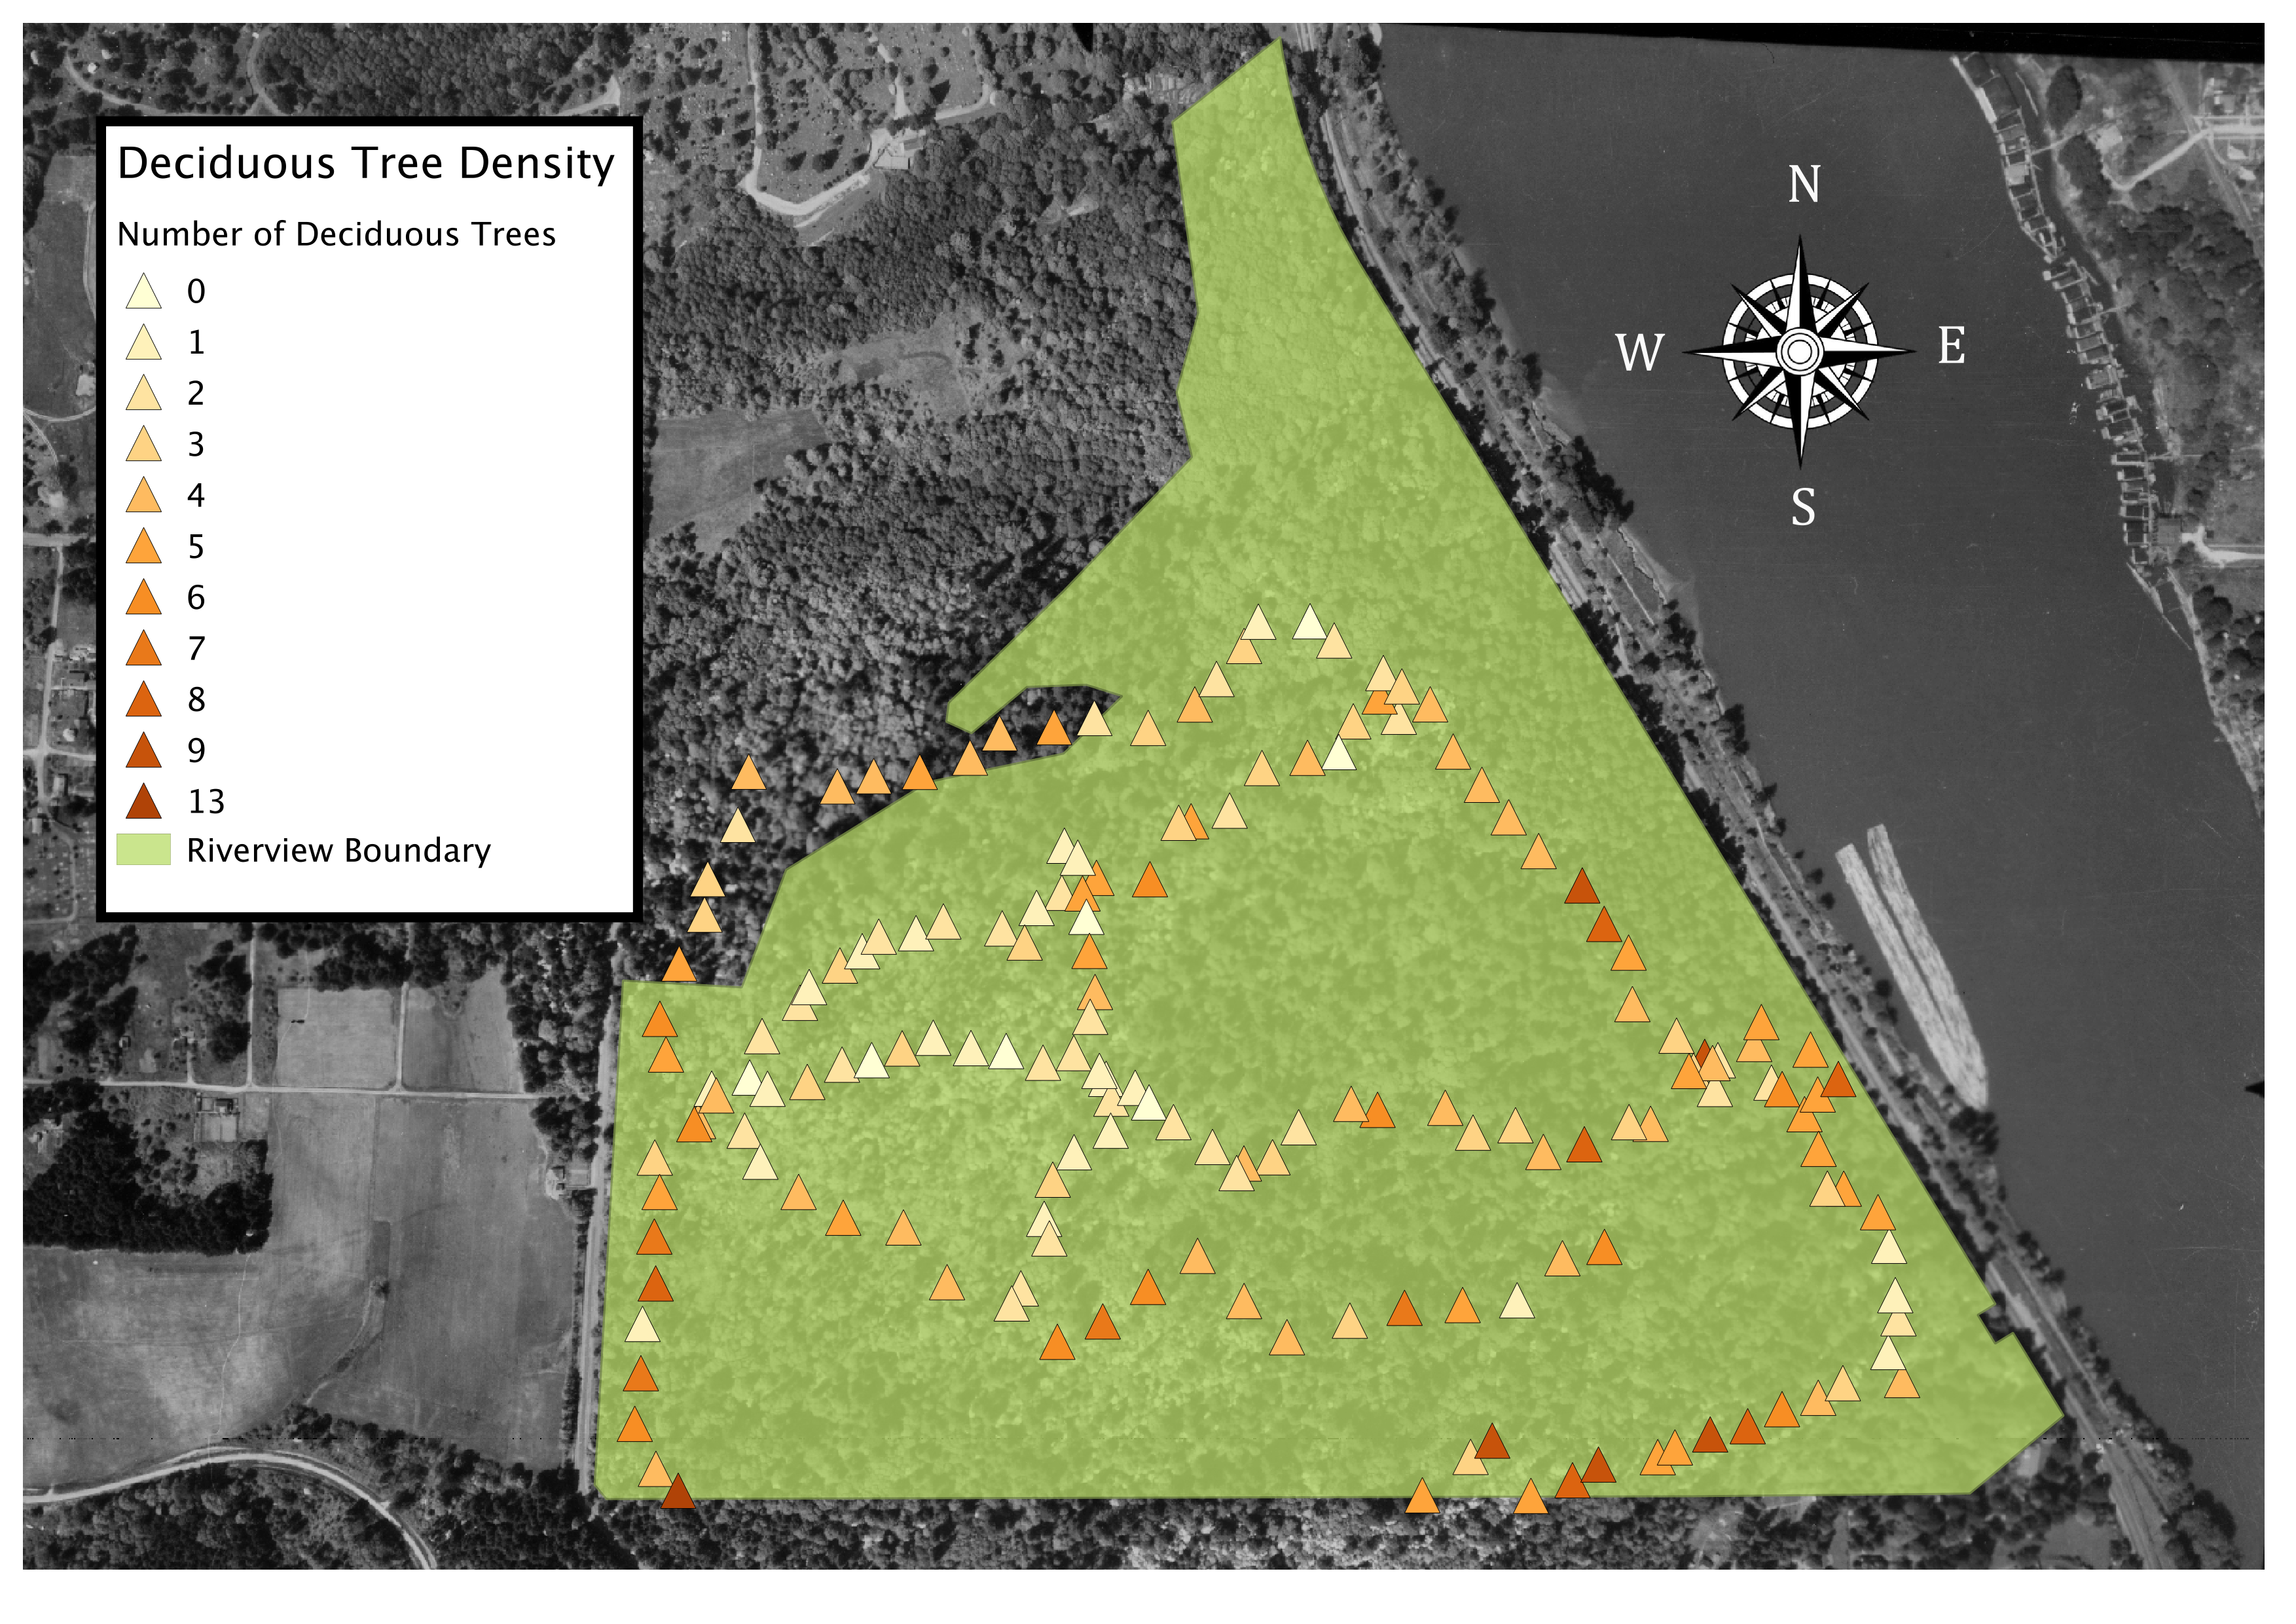
These deciduous trees included Bigleaf Maple, Black Cottonwood, and Red Alder. According to the map, there are significantly more deciduous trees in Riverview Natural Area than coniferous trees. The density of the deciduous trees is shown by the color gradient, where darker brown means there are more trees.
Discussion
In completing this lab, we hoped to shed light on current patterns of English ivy and canopy species, as well as how vegetation may or may not have changed since 1940. We chose to create two maps, one that focused on current and historical canopy cover, and one that displayed current deciduous versus coniferous canopy cover. After further research we found that most deciduous forests in the United States are situated on the east coast. Due to the fact that RVNA was logged at different points in its history, we hypothesized that the deciduous trees may have been introduced in the natural area for purposes of logging. In our maps, we found that not only is the canopy of Riverview Natural Area much more dense today as compared to 1940 coverage, but we also found that there is a much higher density of deciduous trees than coniferous trees in this area.
Deciduous forest biomes are known to have an average yearly temperature of 50 degrees fahrenheit and accumulate an average rainfall of 30 to 60 inches of rain per year. This information makes it much clearer as to why deciduous forests would thrive in the Portland climate. The average annual temperature in the city of Portland according to US Climate Data, is 54.5 degrees fahrenheit and average annual rainfall accumulation is 35.98 inches. By transplanting an invasive species into an environment similar to their native biome, sets up such species–in this case deciduous trees–for the best chance for successful maturation and growth.
Although we collected a fairly high volume of data for this study, we were still constrained to the pathways of Riverview in an effort to preserve the surrounding habitats. This limited the amount of randomization we could achieve throughout our sample area. Since we only collected data on pathways, there are a number of human influences that could have affected our data collection. Additionally, since the data was collected by eleven different groups of people, the standards for each data category were not necessarily consistent.