As our first project in (Un)Natural Disasters, we mapped the various vulnerabilities in our very own city: Portland, OR. The rationale behind this project was that colleges and universities are generally well-known in the community, and are known to have both material and human resources that could be of use to people. Therefore, they could potentially be places that people in the surrounding community come to for help in the event of a disaster. If that college or university has knowledge about the vulnerable populations surrounding their campus, they have the opportunity to prepare by compiling more resources. With this in mind, we chose six campuses in Portland based on highest enrollment: Lewis & Clark College, Reed College, PSU, University of Portland, OHSU, and Concordia University. We omitted PCC due to its multiple campuses, but with more time this would also be an important population to analyze. Each student in the class was assigned to a school. Using ArcGIS, we created a half-mile buffer around each school, assuming that people wouldn’t want to walk much further than that after a disaster. Each of us then examined a different vulnerability parameter: I chose to map racial distribution, since race is an important variable in determining vulnerability according to Portland’s Planning and Sustainability Department.
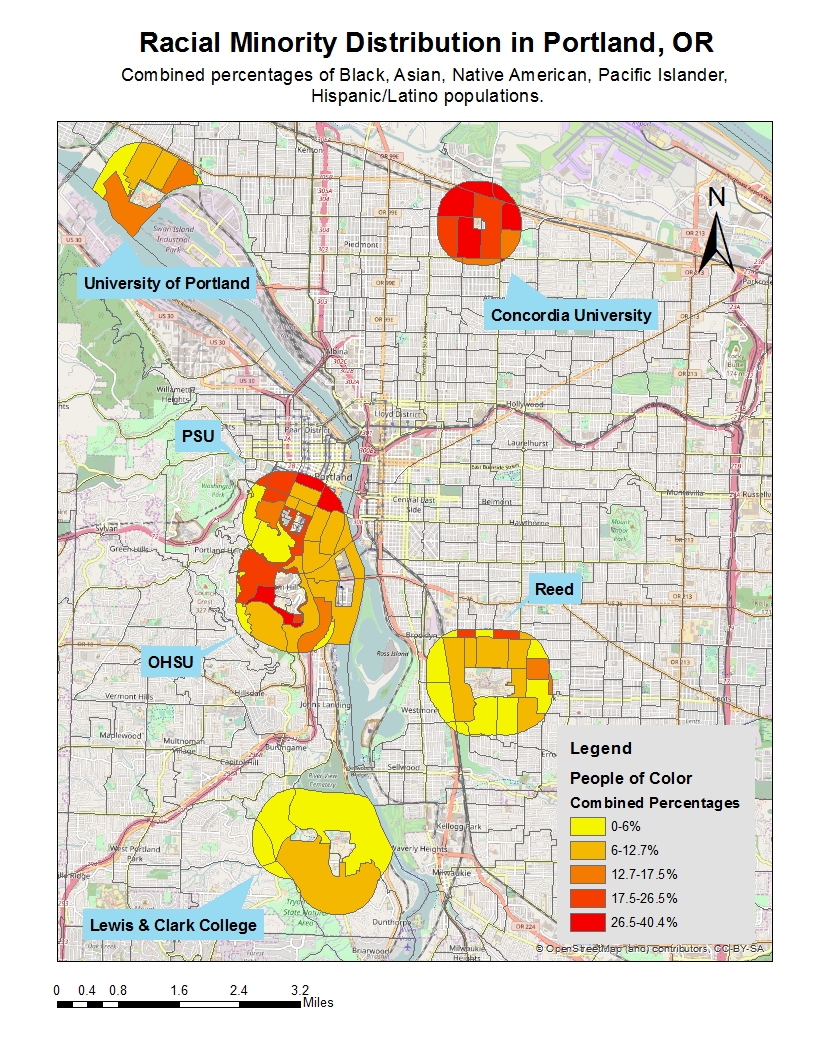
To create this visual, I made a buffer around my assigned campus (Lewis & Clark) and intersected it with American Community Survey data (collected by the U.S. Census Bureau). I chose to display percentages of minority communities in each area, so I combined each race sub-set since minorities are already such a small fraction of the population. After creating this visual, I was curious about what the break-down of the higher minority populated areas was, so I manipulated the data to include only the areas in the buffer zones and then focused on the race data. From there, I created a bar graph to display my findings.
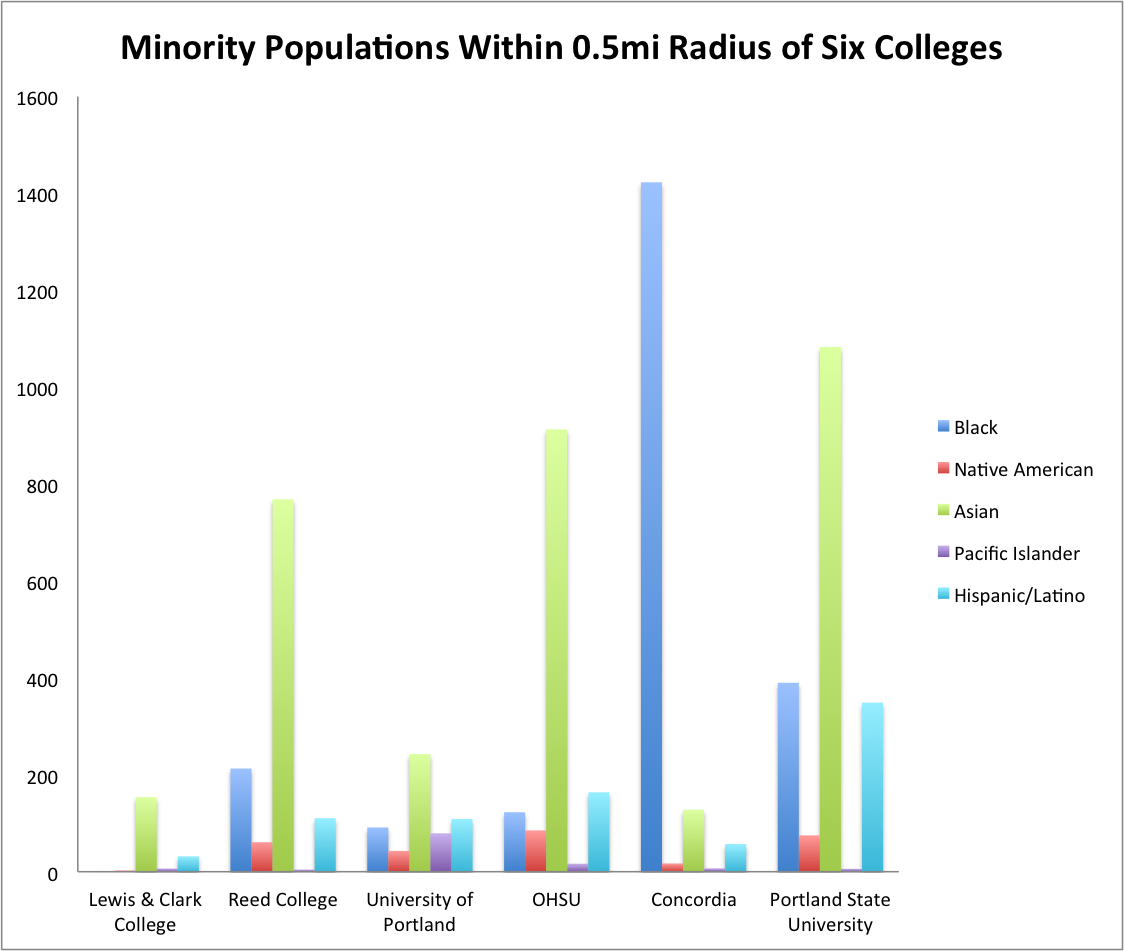 As it turns out, most of the red areas on the map are actually Asian communities, with the exception of Concordia having a predominantly Black population around its campus. The criteria that Portland stated could cause displacement vulnerability was living in a community with over 27.4% people of color. They did not mention how this varies between races. Based off of these findings, PSU, OHSU, and Concordia (and potentially Reed) should consider their role in supporting these potentially vulnerable communities in the face of a disaster. It will be interesting to compare my findings with the other attributes that my classmates analyzed such as socioeconomic status, number of renters, and number of residents ages 18-35.
Some factors to take into account are buffer size, obstructions, other local trusted organizations, and proficiency of community. The buffer size may or may not be the correct size. People might walk less or more depending on how much they need help. Obstructions like highways or large parks or hills could deter people from seeking assistance from these campuses. There could be other trusted organizations in the area such as churches, high schools, or other non-profits that may be more prepared to offer help, which could decrease reliance on colleges. Finally, if the community is already prepared on a neighborhood level, they may be more able to rely on each other instead of other external help. Next, we will examine which communities are most at risk based off of the specific hazards in the area. This could affect how many people are able to make it to a college campus, and which areas will be most heavily impacted in the event of an earthquake.