GIS: ArcMAP
Utilizing ArcMAP software, we compared different levels of household incomes and layered the number of community garden plots and people waitlisted for those plots over a map of Portland neighborhoods. Shape files with data on household income by neighborhood in the Portland area were taken from the RLIS Discovery section of the OregoMetro.Gov page, accessed 11/22/2015.
Community garden plot availability and waitlist data were taken from the Portland Parks and Recreation page, and the raw data can be found by searching for keywords “garden” on the main ArcGIS online database, both accessed 11/22/2015.
We mapped the number of plots currently used in community gardens (represented by blue bars), as well as the corresponding waitlist for any given garden (represented by yellow bars). This plot and waitlist data was mapped in ArcMAP over a shape file of Portland neighborhoods and their respective average household incomes. Income levels were split into 3 categories: <$49,999, $50,000<X<99,999, >$100,000 per year income. The result gives us a spatial view of how socio-economic level can affect interest in community gardens.
Example Map: See Results Page
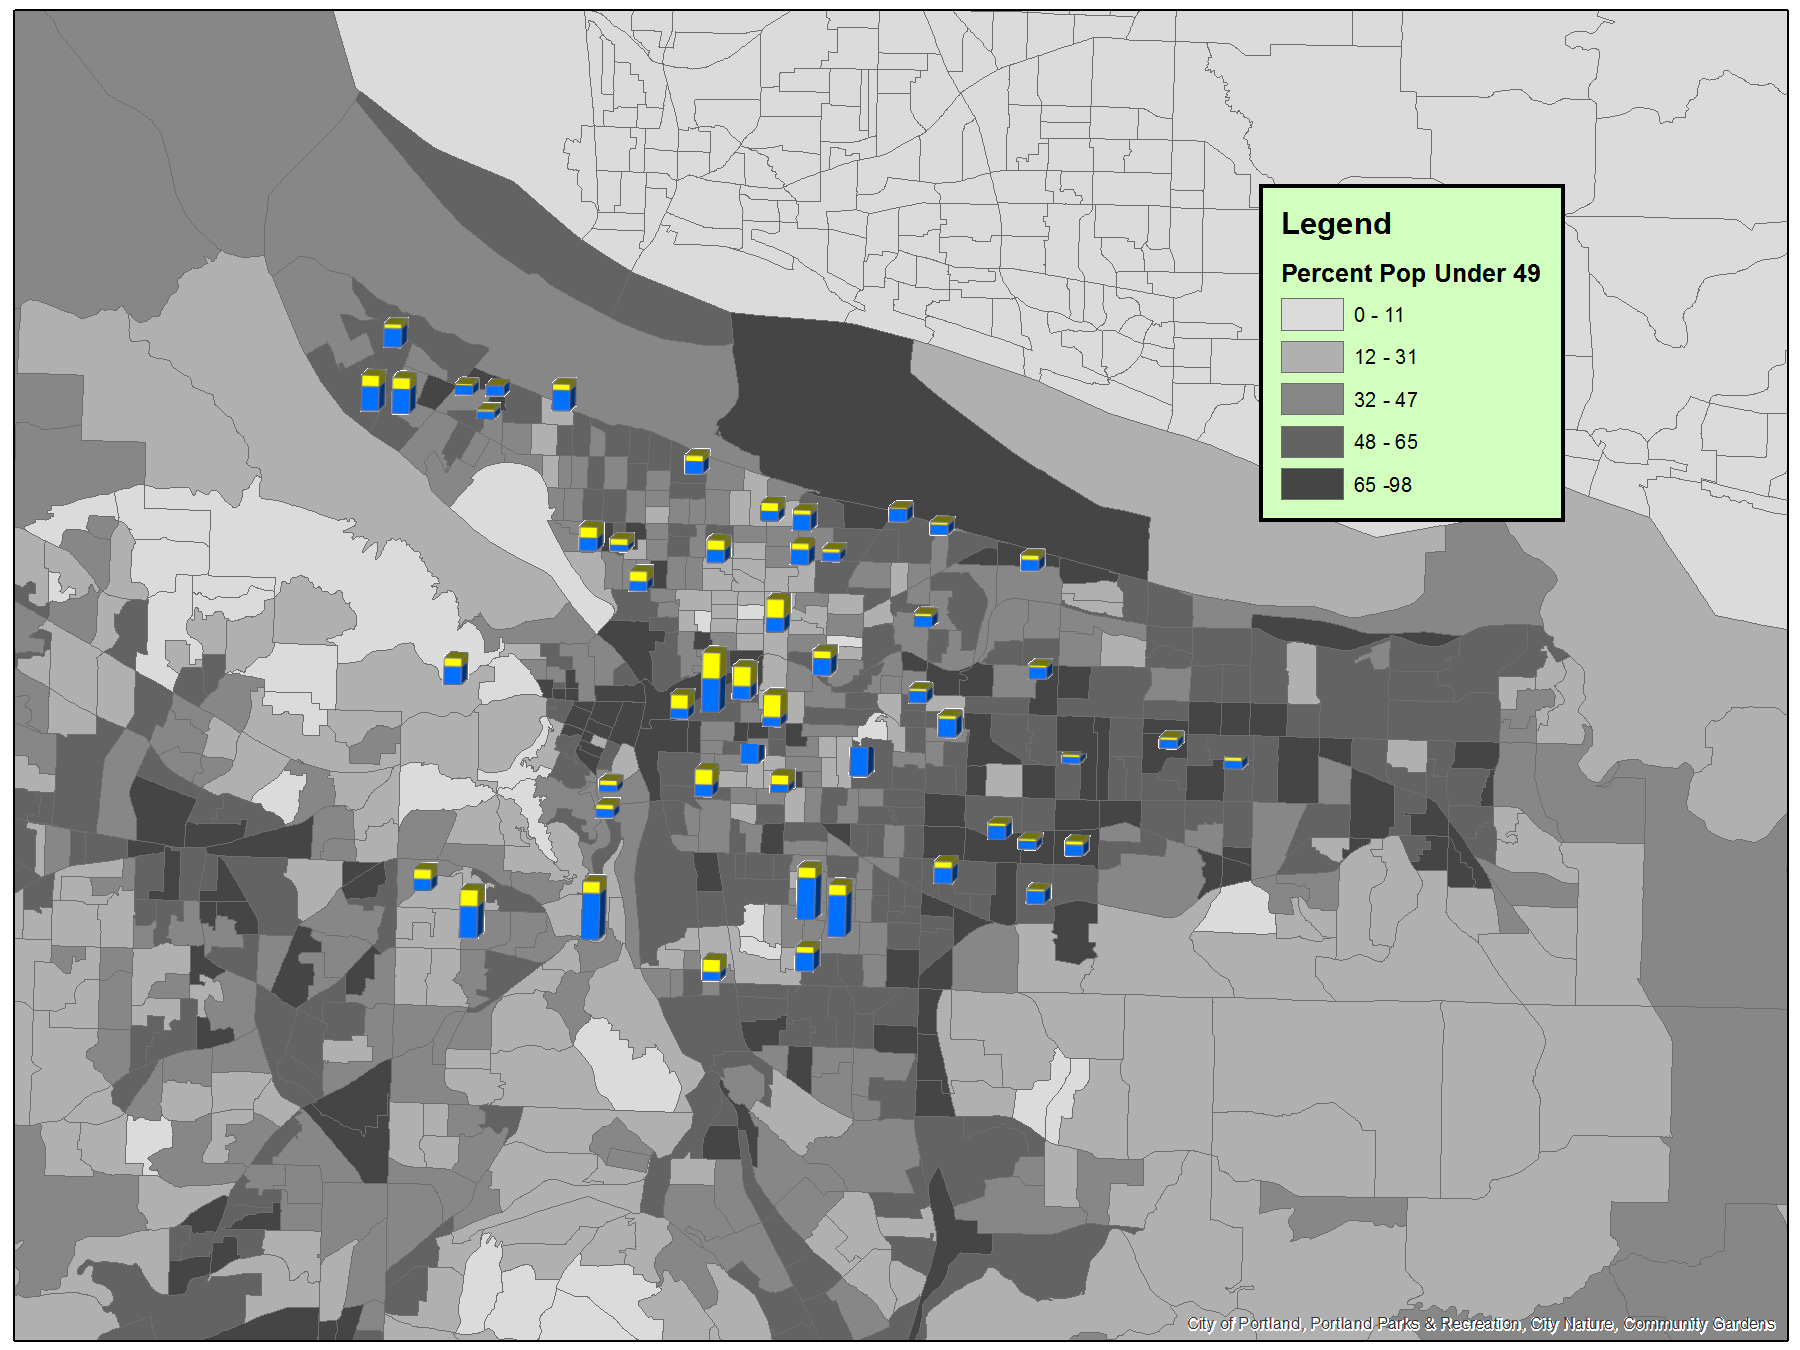
Distribution of Households with <$49,000 Income/year with Number of Community Garden Plots & Waitlisters
Inferential Statistics
1. PEARSON CORRELATION
Utilizing the data taken from ArcGIS.com and Portland census data (see GIS: ArcMAP section above), we chose reduced our sample size from all of Portland’s neighborhoods to only those with data available for both income levels AND number of garden plots & waitlists; this gave us a sample size of 47 Portland neighborhoods to run statistics testing on. For each of the 47 neighborhoods, we noted the income level (split into three categories, see GIS: ArcMAP section above) and the number of garden plots & waitlists. Exporting this into Google Sheets, we ran Pearson-Correlation tests on each of the three income categories to observe patterns between number of plots/waitlists and income level. The results are as follows:
| Income Level ($1000’s/year) | Pearson-Correlation |
| >100 | 0.36 |
| 50<x<99 | 0.017 |
| <49 | -0.32 |
Two results of interest are the Pearson-Correlation for income levels >100 and <49 thousand $/yr. They show positive correlations between the percentage of a Portland neighborhood with high (>$100k/yr) income and the presence/interest in garden plots. Alternatively, there is a negative correlation between the percentage of a Portland neighborhood with low (<$49k/yr) income and the presence/interest in garden plots. Lastly, there is no strong correlation for the middle income bracket. Conceptually then, the presence/interest of garden plots has a positive correlation with the presence of higher income households.
2. ANOVA
From our sample of 48 Portland neighborhoods, we assigned each neighborhood with a >50% presence of <$49,000/yr income households a “1” value and those neighborhoods with <50% presence a “0” value in order to understand the relationship between low-income dominated neighborhoods and interest in community gardens (plots present + # people waitlisted for a plot in each neighborhood). We then ran an ANOVA on the RStudio software and found the following.
Null Hypothesis: there is no significant relationship between low-income dominated neighborhoods and interest in community gardens.
Alternative Hypothesis: there is a significant relationship between low-income dominated neighborhoods and interest in community gardens.
| Degrees Freedom | Sum Squares | Mean Squares | F-Statistic | P-Value | |
| Majority | 1 | 6968 | 6968 | 4.338 | 0.043 |
| Residuals | 45 | 72286 | 1606 |
Actor Map
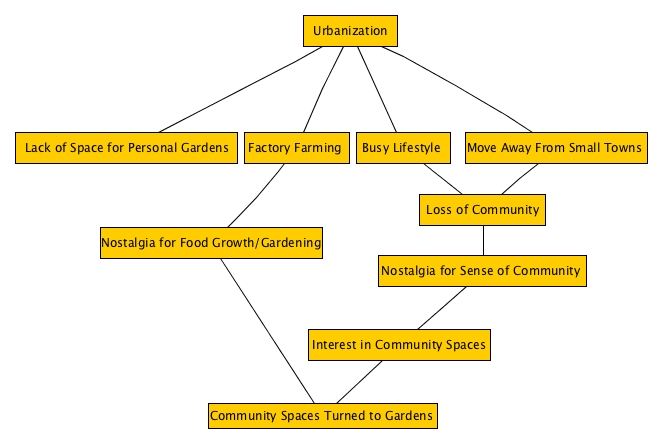
Through reading literature on urban community gardens, we created an actor network map outlining some pertinent factors that have led into their creation and implementation. Starting with urbanization as the overarching driving factor behind urban community gardens, there are multiple reasons, including a sense of nostalgia for a pre-urban way of life, that create the drive behind urban community gardens.
Qualitative Analysis
On Tuesday, December 1st, our team went to a showing of CAN YOU DIG THIS? (Delilia Vellot), a documentary following the lives of four individuals in South L.A. who have taken an interest in urban gardening. The backgrounds of these individuals range from young to elderly, those with and without criminal records, with and without families, but what connects them all are their African-American identities, the area that they live in, and their low socio-economic status. The documentary, through following these four individuals for a year, sends the audience a message that shoots down a very common argument against urban gardening: that urban gardens and farms benefit only post-materialistic middle to high-income households. Afterwards, the theatre held a panel led by four leaders in the urban gardening movement in Portland and beyond. We followed the methodology utilized in our Literature Analysis lab by transcribing what was said during this panel and applying certain characteristics to key quotations. The result was a “general consensus” on key questions such as whether urban gardening positively affects low-income households, global/local applicability, and whether urban gardening is a solution to large world problems such as food security.