 The beginning of this past week built on prior work, as we continued thinking about environmental questions. In addition to questions being descriptive, explanatory, evaluative, or instrumental, we learned that they can pertain to issues, systems, objects, or places. Issue-based questions were dismissed as vague and basically unanswerable, while system-based questions were regarded as too uni-disciplinary. Instead, asking object or place-based questions (or ideally, situated object questions!) was emphasized as the core of our future ENVS research. We also covered some general information on environmental analysis, setting up our data-driven lab by looking at what kinds of data one can collect, and covering the hierarchies of data from raw information data to methods to analyze data to theories giving a broad explanation of issues to ideological frameworks providing a general attitude towards data.
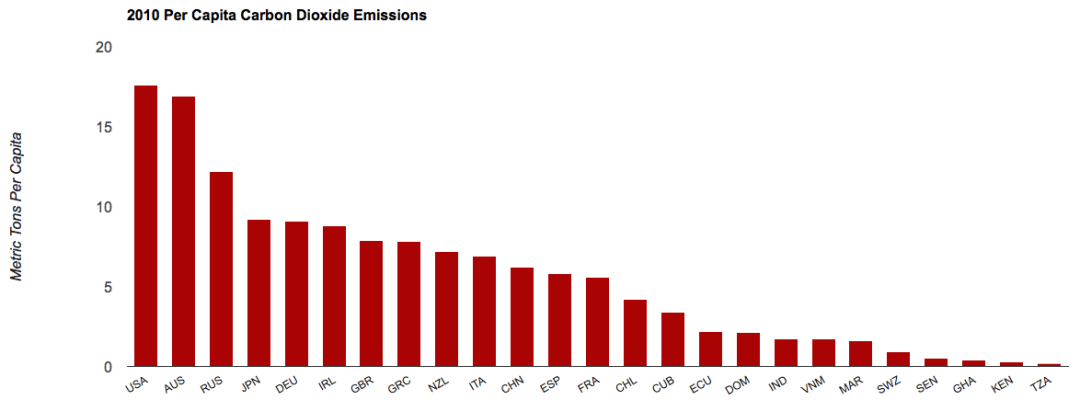
The most significant portion of the past week in ENVS has been spent around our data analysis lab. My group studied the per capita carbon dioxide emissions of the countries which Lewis and Clark offers overseas programs in, pulling data from the World Bank into a spreadsheet, where we graphed the data, found existing literature on the subject, and offered our interpretations of the data. You can find the full results here. Overall, we found both the general divide between developing and developed countries in terms of per capita carbon emissions, as well as large disparities within the set of developed nations. The IPAT model was central to my own thought processes in interpreting the data, and it provided the general framework for thinking about the driving forces behind the data. Since population was held constant (as it’s a per capita analysis), the relevant factors are “affluence”—per capita economic production and activity—and “technology”—interpreted here as the carbon intensity of production. In addition, we looked at a couple of related factors: per capita gasoline consumption, and the market share of alternative energy per country. We took these two variables as representative of the transportation and energy sectors of nations, respectively. This provided another way to analyze disparities in per capita carbon dioxide emissions, stemming from economic growth and carbon intensity.