Whether or not you believe the subduction zone earthquake is going to hit the west coast, being vulnerable in a city during an earthquake is still a great concern, no matter where you are. With that in mind (and The Big One), our class is taking the time to look at communities surrounding college campuses in Portland, Oregon in an attempt to better understand the possible community members that would seek colleges as a refuge in times of crisis. This type of information can help colleges prepare for particular groups of community members, as well as give opportunities for each school to reach out to target community members in order to help them better prepare themselves.
As a class, we decided that mapping this information through ArcGIS, followed by statistical analysis through Excel, would be the best way to represent our findings. In order to do this, we mapped a half-mile buffer zone around six Portland college campuses (Lewis and Clark – LC, Reed, Portland State University – PSU, Oregon Health and Science University – OHSU, University of Portland – UP, and Concordia University). Within each half-mile section, we mapped the distribution of certain Census data attributes, such as total population, gender, income, race, home-ownership, etc. Each type of information can help determine the extent and way in which an individual, family, or community are vulnerable during an earthquake. Many of the data attributes are aspects of vulnerability that I have thought a lot about, such as gender, income, or race. However, I chose to look at home-ownership because I was surprised to learn that renting a home can put people at much larger risk than I would have ever expected. This is especially interesting to look at around colleges, where many students find themselves renting, often with very little say in the conditions of their homes (myself included).

This map shows the percentage of renters in each polygon “community”. The darker polygons demonstrate a higher number of renters, while lighter polygons demonstrate a higher number of home-owners. This can help us understand the distribution of renters around the city as a whole, as well as being able to compare and contrast colleges in different urban environments, such as downtown colleges versus neighborhood colleges:
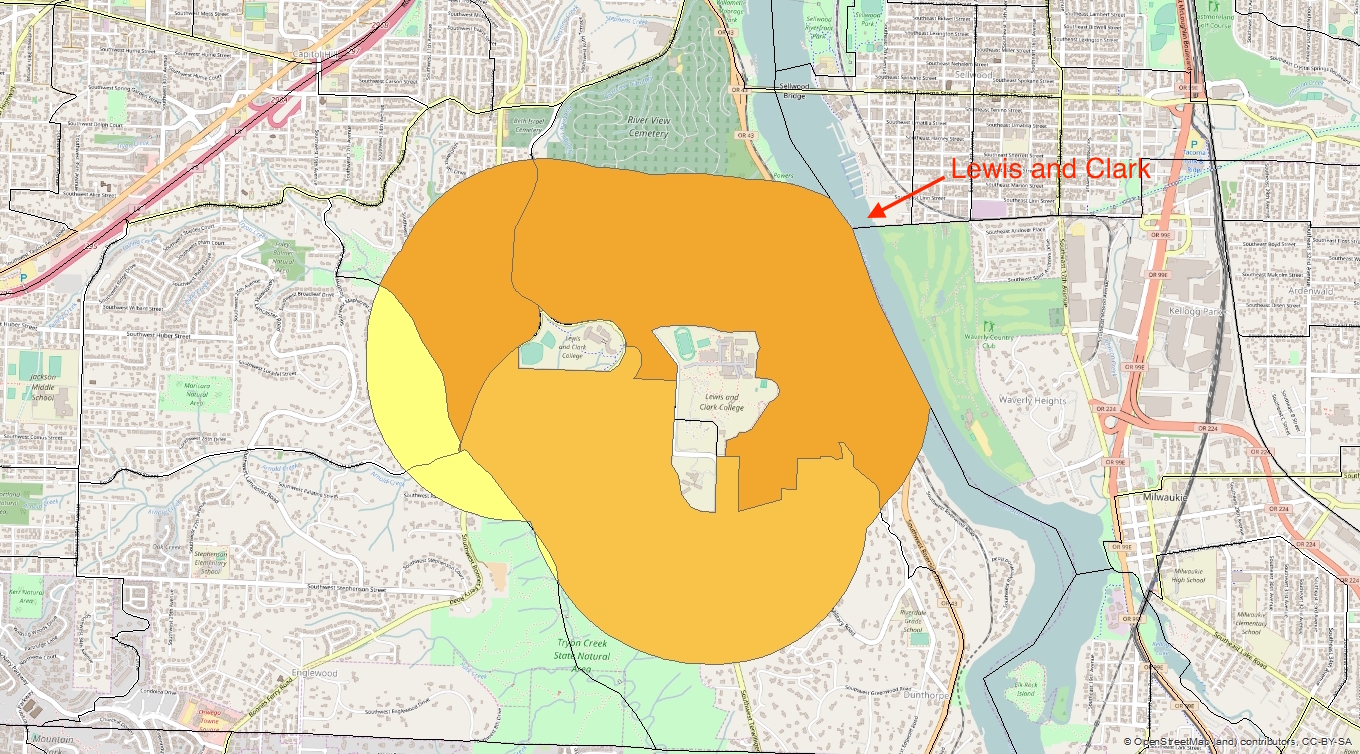
For example, Lewis and Clark’s surrounding communities seems to be a combination of fairly wealthy home-owners and low-income college student renters. The ratio is significant enough to see where most students are living (north of the campus), yet the color scheme of this map is very different from downtown campuses. It is also important to note that polygons in questions are much larger and fewer than other campuses, which means the number of residents, or total population, is also fewer than downtown. This is important to note in the projected number of residents that would most-likely come to this school. It is also important to not that it is unlikely to have many other resources for community members in a secluded community like the one near Lewis and Clark.

PSU and OHSU are valuable to juxtapose beside LC because they reinforce the importance of taking into account the space and lifestyles of those residents around schools. For example, people are much more likely to rent apartments downtown, regardless of income (which can determine the quality of apartment, so it is still an important vulnerability factor). However, they are also much closer to other resources and possible evacuation points, such as sports arenas, churches, etc. They are also much closer to governmental facilities, and are perhaps more likely to receive aid first. Then again, the infrastructure of downtown (apartments, offices, etc.) could cause even greater threat to livelihood and safety.

Looking at this distribution through this graph, to the right, brings even more interesting components to the table. How should schools that have an almost 50/50 split between renters and non-renters, such as Reed, have different strategies for emergency procedures from colleges with huge percentage differences, such as LC and PSU? It is not necessarily just about finding where renters are and adjusting plans accordingly, it is also about making sure that the balance between the two are taken into account during planning.