Have you ever tried to differentiate between a bell bird call and a Tui call? It is difficult. This was the challenge of our science challenge. We did not discover this until 24 hours into our time at Rotoiti where we conducted our study. Despite these obstacles, we did our best to answer our research question; how will response frequencies of New Zealand native birds (specifically tui, South Island robin and bellbird) change over time in response to a repeatedly broadcasted call?
We headed out into the bush on a Friday morning to transmit our first calls. But what we thought was an early hour didn’t exactly coincide with the birds’ definition of morning. We finished our test site with a significant amount of call responses, but when we finally made it to our first data collecting sight it was already 11 O’Clock and the afternoon was heating up. Literally – it was too hot for the birds to be out and about. So we altered our game plan. With the help of a Department of Conservation worker we decided to only collect data before 10:30am and after 5pm.
With our methods solidified we set out the second day bright and early. We began our sampling at a site by listening and watching for one minute for any initial presence of the birds and took note of this. Next we transmitted ten calls of one of our birds, recording for thirty seconds after each transmission. While recording we listened for and counted responses of our chosen bird to get our initial data before being able to analyze our recordings, also in case the recorder could not pick up calls farther in the distance. After ten transmissions and recordings of one bird we waited five minutes before the next set to ensure that the next bird would not be influenced by the calls previously transmitted.
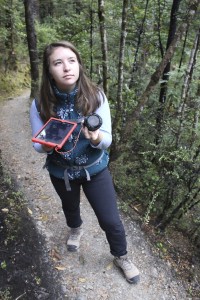
Emma transmits recordings of Bellbird calls.
After spending three days collecting our data, we had only 9 hours to analyze the numbers, create a presentation on our project, then present it to the group. For “GROUP LOVES MAMMALS” (our team) this process went fairly smoothly. We pulled together all our data in a Google doc spreadsheet and quickly put together some averages for the various species. Grace handled the figures, while Emma was tasked with adding information to the PowerPoint. This worked well because of the time crunch and allowed us to focus on and utilize our strengths.
In the last hour and a half before the presentations, the house had an air of excitement. While some groups were wrapping up their fifth rehearsal before dinner, other groups were still searching for an empty room to practice in. It was interesting to walk up and down the stairs of our two story hostel and be able to hear every group pounding out their presentation in such a small space. This was a true test of organization and communication skills.
Every group presented with enthusiasm on their research and while not all the data was strongly conclusive, we all had some new found knowledge to share. For our group the data was not strong for a couple reasons, but we were still able to make some speculations with a grain of salt. The data we used for our calculations was purely from listening during sampling because we were not able to double check on the recordings before presenting. When we averaged responses for each bird and graphed it over time there were two interesting trends. The first was what we called the “lag trend”. The lag trend was a lag in responses from the birds between the first transmission and the second, where there was a peak in responses consistent for all the birds. We believed this was because the first call caught the attention of the birds and drew them closer and by the second they were responding consistently. The second trend which we noticed was another peak in responses between the seventh and eighth transmission. We suspect that this is because at that point all of the birds in the area that could hear the call had gathered and were responding.
Lastly we did our best to directly answer our research question with the data we had so far: how do response frequencies of New Zealand native birds change over time in response to a repeatedly broadcasted call? Our bellbird data was the strongest of our 3 birds, because we had the most responses from them, so we used this to tentatively speculate on our conclusions. The average response for bellbirds at the peak, after the lag was 5.25 calls and the average for tenth transmission was 2.25 calls . There is a three call negative trend. Although this is not a strong trend because of the fluctuation in calls, we can tentatively conclude that response frequency decreased overtime. The significance of this conclusion is that studies which utilize this method of bird census are not completely affective because the birds begin to lose interest after a while, therefore responses are an inaccurate representation of bird numbers. Although the data collection stage is behind us, we have some more analyzing to do over the next few weeks and our conclusions may change significantly. Who knows what’s in store!
Over and out,
Grace and Emma