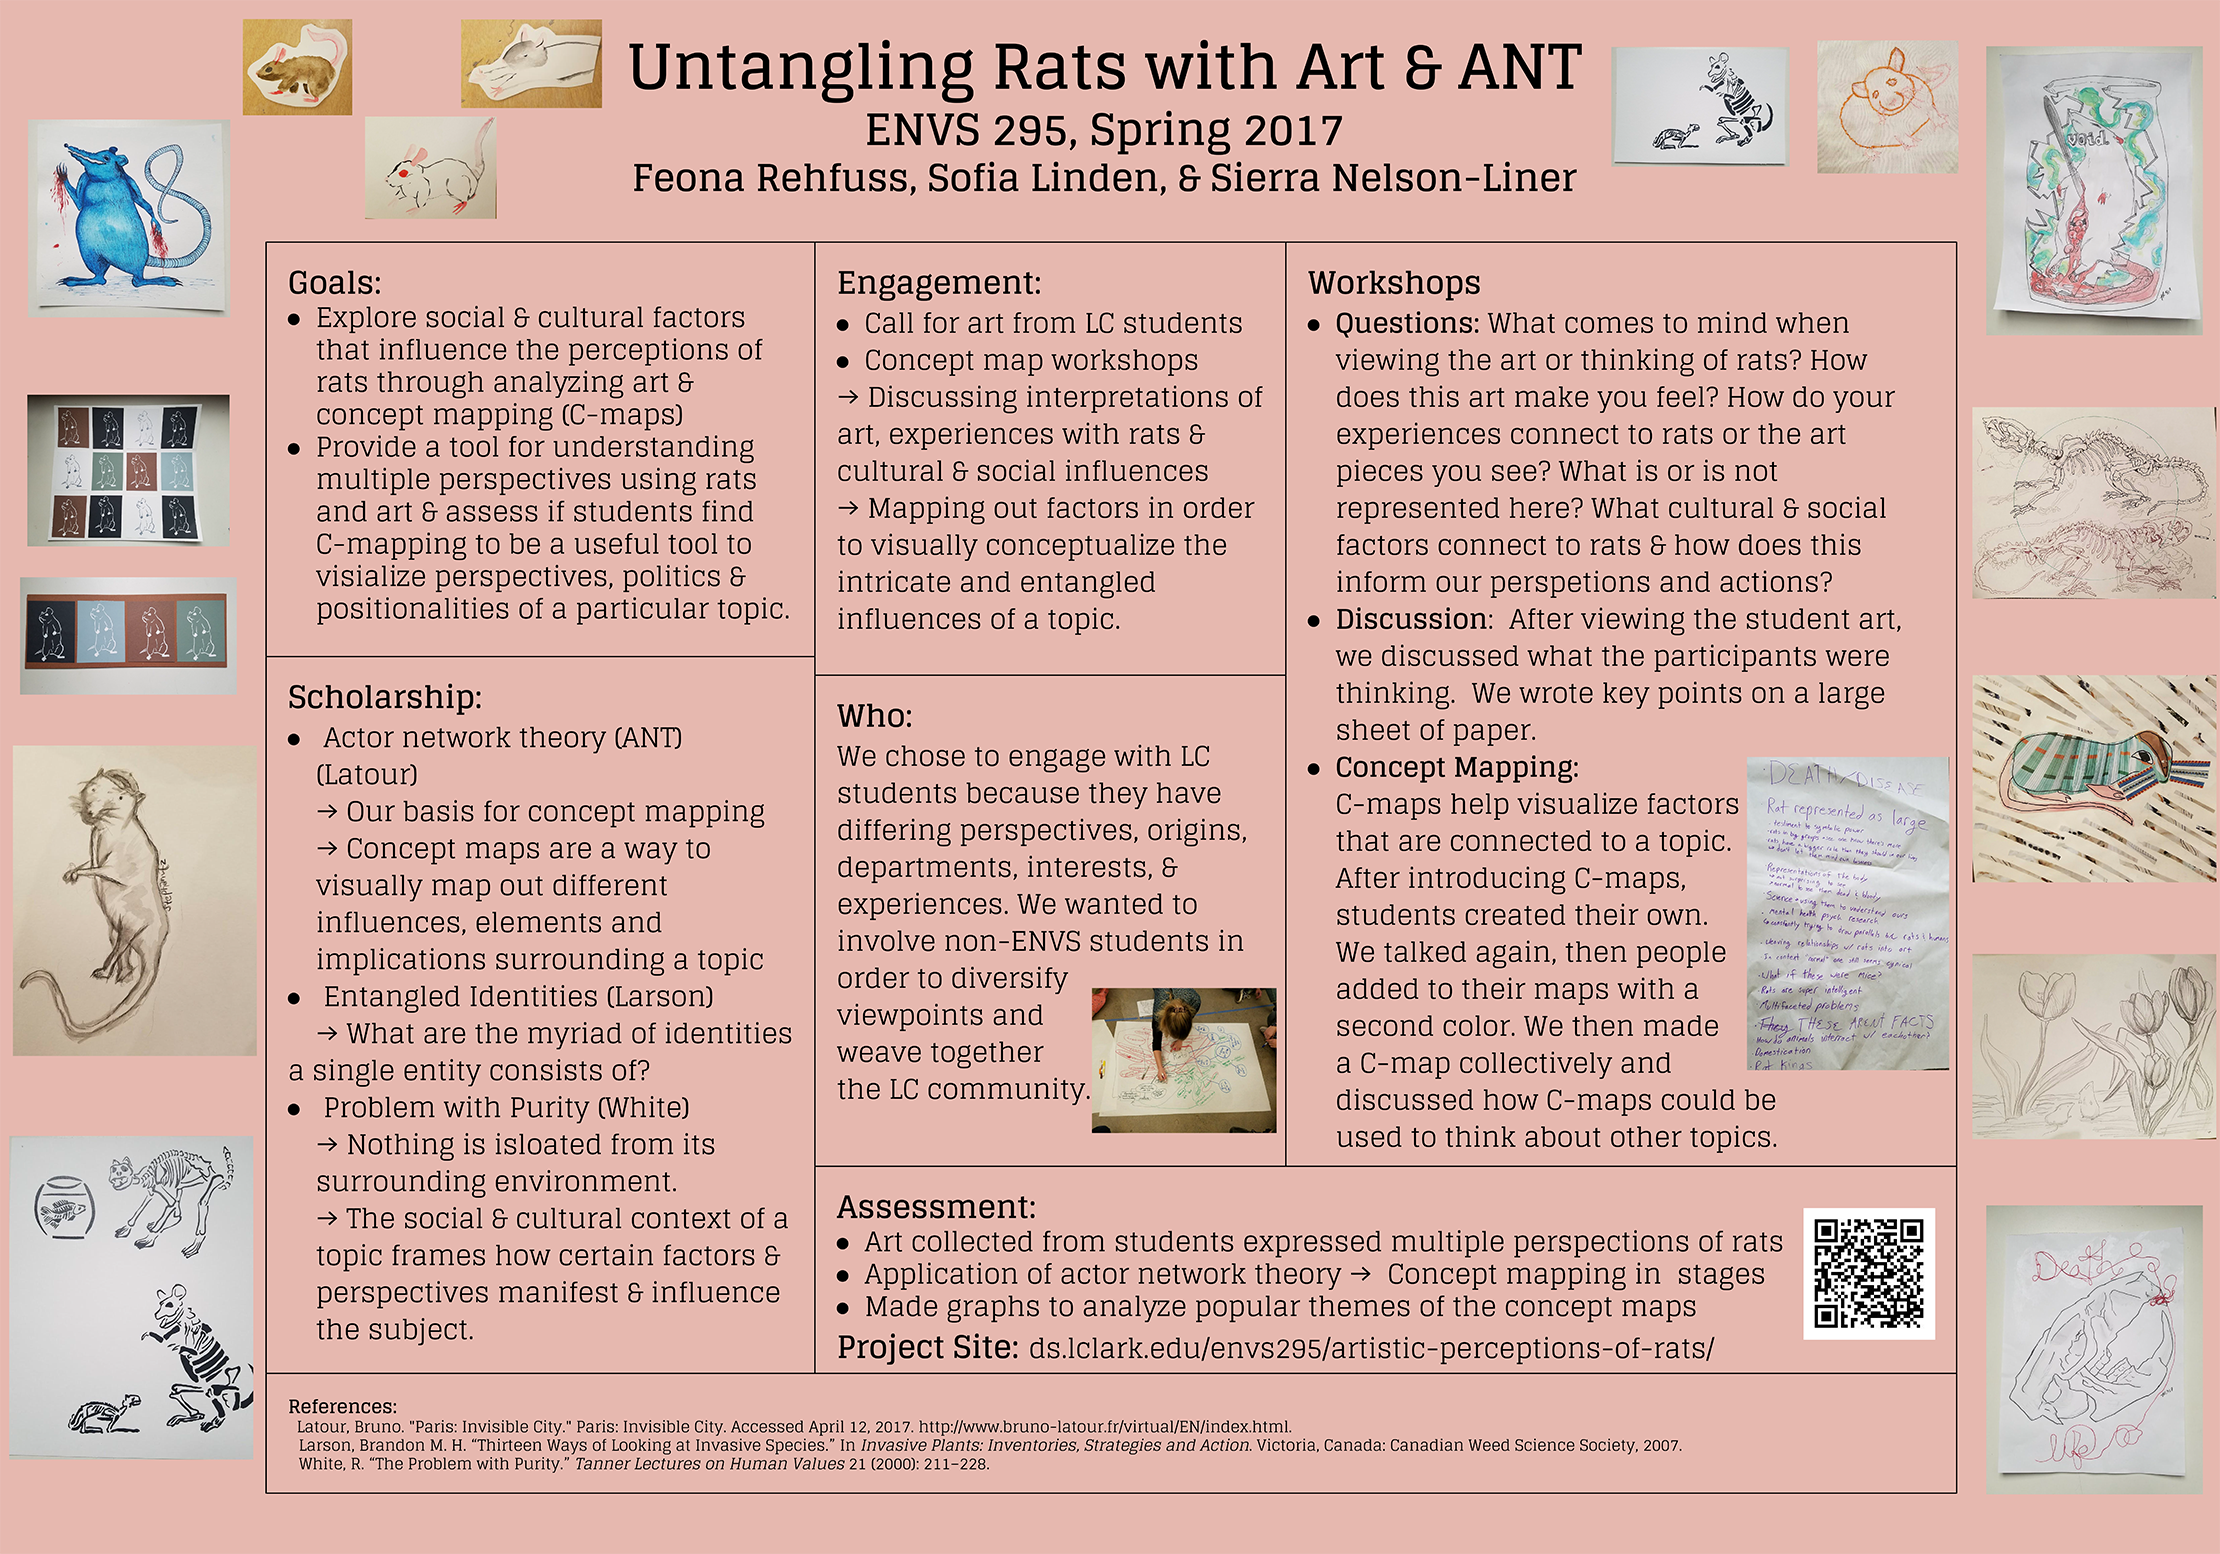
This poster is the final product from our festival of scholars presentation. We presented this poster April 14, 2017 along with a digital display and ipad minis with the art. It was helpful to have the poster as a map of our project so the people who did not attend the workshop could understand what we did during the workshops as well as the progression of the project. The digital display helped us show the analysis of the concept maps as well as the art that we had during the workshops.
The assessment of our project aimed to gather quantitative data about the concept maps. This is because we had a lot of qualitative data from the art and the visual of the concept maps themselves. The objective of analyzing the words and visuals from the workshops was an attempt to understand if we made progress teaching the concept map tool to students, as well as broaden their perspectives.
Below is a visual analysis of the concept maps that were created by the participants who participated in our project. We focused on both the structure and development of the concept maps as well as a word-analysis to understand the major themes and perspectives discussed. The graphs are separated by workshop 1 and 2 as a way to see if the concept map progression and content changed between the workshops. For instance if there was improvement on the number of actors connected to the central idea of rat, if the actors were connected together, if a human perspective was mentioned and if questions were asked between the two workshops. This could be because of the amount of time we spent teaching the maps vs having a discussion, that there were different kinds of people who attended each workshop, as well as the different perspectives that may have held more of a focus than others.
Analysis of Concept Map Structure:
Workshop 1
The data used to configure Figure 1 was from 7 concept maps (c-maps) that were created during the first workshop.
About 42% of the c-maps contained 4 or more actors that connected directly to the focus concept which in this case the word “rat”. A total of 100% contained 4 or more actors that were connected to each other. This is quite impressive because it shows that the students were not only able to see how actors connected to rats directly, but also how they connect together to create a network of influence.
About 85% mentioned humans. This was a common theme in the first workshop with reference to the domestication, social media’s representation, and the personification of rats by utilizing key perceptions of their behavior and physical appearance.
Roughly 42% of the concept maps also included questions. This wasn’t something that we asked them to do specifically, but we think it shows that they were continuously engaged with the topic. Through adding their own questions and curiosities about the differing perspectives they attempt to make sense of how they might relate to one another.
The word “pet” was used in 57% of the c-maps. This was a constant theme in our discussion because two of the participants owned rats as pets. This was interesting to talk about because none of our art supported this perspective. The art had strong themes of death and decay, life and domestication. Throughout the discussion we talked about the pet rat industry and what makes it so different from using rats for experimental purposes.
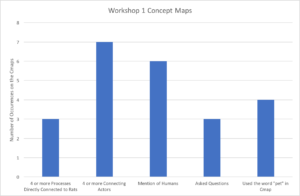 Figure 1: Analyzing Themes in Workshop 1 Concept Maps
Workshop 2
The data for workshop 2 is expressed in Figure 2. This data was compiled from 7 concept maps.
28% showed 4 or more actors directly connected to rats. This is lower than the first workshop possibly because there was more time allocated to discussion. The same can be said for 4 or more actors connecting to each other. 71% showed 4 or more actors connecting to each other. This is still a high percentage though, and so it was wonderful to see because we can ascertain that they were able to see how intertwined perspectives and processes can become.
Humans were mentioned 28% of the time with reference to both positive and negative human perspectives, namely rats within the discourse of science, companionship, and belonging. Questions were found on 14%of the c-maps which expressed interest to further their understanding.
This workshop did not get assessed about the word “pet”. This is because the first workshop used it so frequently it seemed a good idea to mention it. In the second workshop pets were rarely mentioned, and no other word seemed sufficient enough to take its place. The words of the cmaps are important though and are analyzed further down the page in figures 5-8.
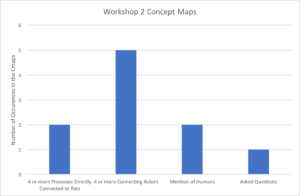 Figure 2: Analyzing Themes in Workshop 2 Concept Maps
Tracing Development Through Color:
To understand the development of the concept maps over time we asked participants to switch the color they were using on their concept map each time we broke for conversation.
Workshop 1

Figure 3: Amount of Workshop 1 Concept Map Development
The data that is expressed in Figure 3 is from six concept maps from the first workshop, which reflects the number of actors represented. There was supposed to be three colors, but none of the concept maps made it that far. This is interesting because when we came up with this idea of multiple colors we expected the concept maps to grow larger with time as more and more perspectives were discussed. This graph shows that the majority of the thinking occurred individually. Or rather, the more we discussed, the more each participant was able to hone in on the actors that directly related to their focus. Further still, the content heavy discussions may have lead people to be too engaged to take notes or didn’t want to be redundant.
Workshop 2

Figure 4 shows a similar trend. The data in figure 4 was collected from 6 concept maps, which reflects the average number of actors present. This workshop had a few more actors. The biggest difference between Workshop 1 and 2 assessed here is that the average for the two colors in the second workshop is much closer. The data presented in figure 4 somewhat supports the hypothesis that with further discussion, more perspectives would be explored and expressed.
Overall the analysis of concept map structure revealed that students are just that; students. They took a hold of the challenge and learned through the discussion a new way to organize their thinking. I also came up with the criteria of grading the cmaps after they were created. This means they were unaware of the standard or criteria I was setting for a good concept map. I feel confident that if they continue to practice concept mapping, and were told the specific things to look out for and grow upon, they would be able to create more detailed and structured maps each time.
Word Analysis of Concept Maps from Both Workshops
In order to explore the variety of perspectives expressed by students, word clouds were constructed from words used in their concept maps. Both workshops were used in this word analysis to gain an understanding of the overall perspectives discussed in this project. As a reference; while looking at the cmaps he bigger the word is in the image, the more the word was used repeatedly throughout the concept maps.
Figure 5 depicts the more positive side of the features and behaviors of rats. The word cloud here closely resembles a list because the words were used only once. We decided to add the word “pet” in a different word map below because some participants saw pet rats as positive and/or negative.

Figure 6 shows the negative feelings that the participants associated with rats. Again, the bigger the word, the more frequently it was used to describe them. Many people may have associated rats in this manner because a lot of our art was associated with these words.
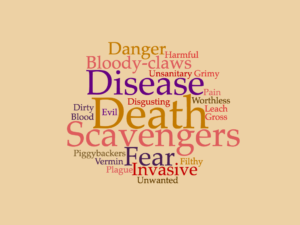
Figure 7 focuses on the many different perspectives that were explored. The three biggest ones seem to be rats as pets, science experiment subjects, and rats presented through a human perspective such as social media.

The final words analyzed are in figure 8. The list illustrates the different ways participants thought of rats in relation to social media discourse. It was interesting to see the variance of the popular rat characters in movies, shows, and other medias. We showed them a Portlandia clip that got them started.
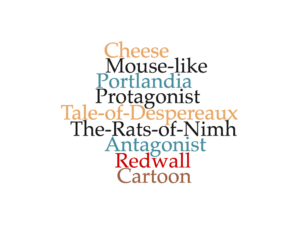 Figure 8: Rats as a part of social media and pop culture
Overall, the word analysis really showed the extent in which these workshops were taken seriously by participants, and that hopefully new perspectives were found. It was wonderful to hear personal stories of interactions with rats combined with joint books read or phrases used and recognized with rats. (One of the phrases I remember being discussed was “your hair is like a rats nest” which was quickly followed by rats nests in New York. The stories pilled up on top of each other and so it was interesting to see which themes were more prevalent or dismissed.
In Conclusion
The workshops themselves received very positive feedback. Participants said they enjoyed the large array of art that presented rats in different ways, which helped them connect rats to a variety of human and non-human actors. In particular, students seemed to be especially excited and involved when working together on the final concept map. If we were to do this project differently it would be interesting to get the same people to talk about a different animal and see how their concept maps changed. Another idea could be to implement an art creation component of the workshop where the participants would have something to take home with them. We kept their concept maps for the analysis, so the participants only had their memories of the workshop when they left. Lastly, placing a stronger emphasis on the criteria for grading the cmaps as well as the color coding as a method to determine progress would make the analysis stronger.
The main differences between the two workshops were conversation topics (see workshops page here), and the amount of people who came to the workshops. The first workshop was all friends, and most of the art was made by us, but by the second workshop we had enough time to advertise to get a larger diversity of students attending the workshop and submitting art. That being said, the workshops had about the same number of participants.
When thinking about broadening these workshops I think it would be interesting to have the workshop in a venue with computers. The concept maps website and app could be shown on a projection. Discussion would be in small groups, and then shared out to the larger audience. I think the focus of this would be to show the technological side of concept mapping, possibly more academic even, but would take away from 1:1 discussion.
Another idea could be to have individuals in a group represent one perspective and speak about the certain pros and cons of that actor. This would require previous knowledge and research, but could possibly be shown as a demonstration by the speakers rather than the participants. If it was with participants they could be given a short page about their actor or perspective and share that out loud. An interesting visual for this would be if the participants stood in a circle and each time a different perspective AKA participant interacts with another through a process then they could be connected with a piece of string from a ball of yarn. Eventually there would be a web connecting the actors together. This could be very impactful for understanding how one action can affect another.
Overall, our objectives of teaching the cmap tool and understanding multiple perspectives were met. The data shows that participants were able to gain an interdisciplinary understanding of rats through the concept maps as well as a clear understanding of how to make a concept map from scratch. Although they did not take their cmaps home we showed them the online interface that can be applied to other academic fields. In fact, most participants said they would use c-mapping with other departments on campus as well as when they think through situations on their own. It is invaluable to learn how to comprehend multiple perspectives and see how they fit together in this growing world.