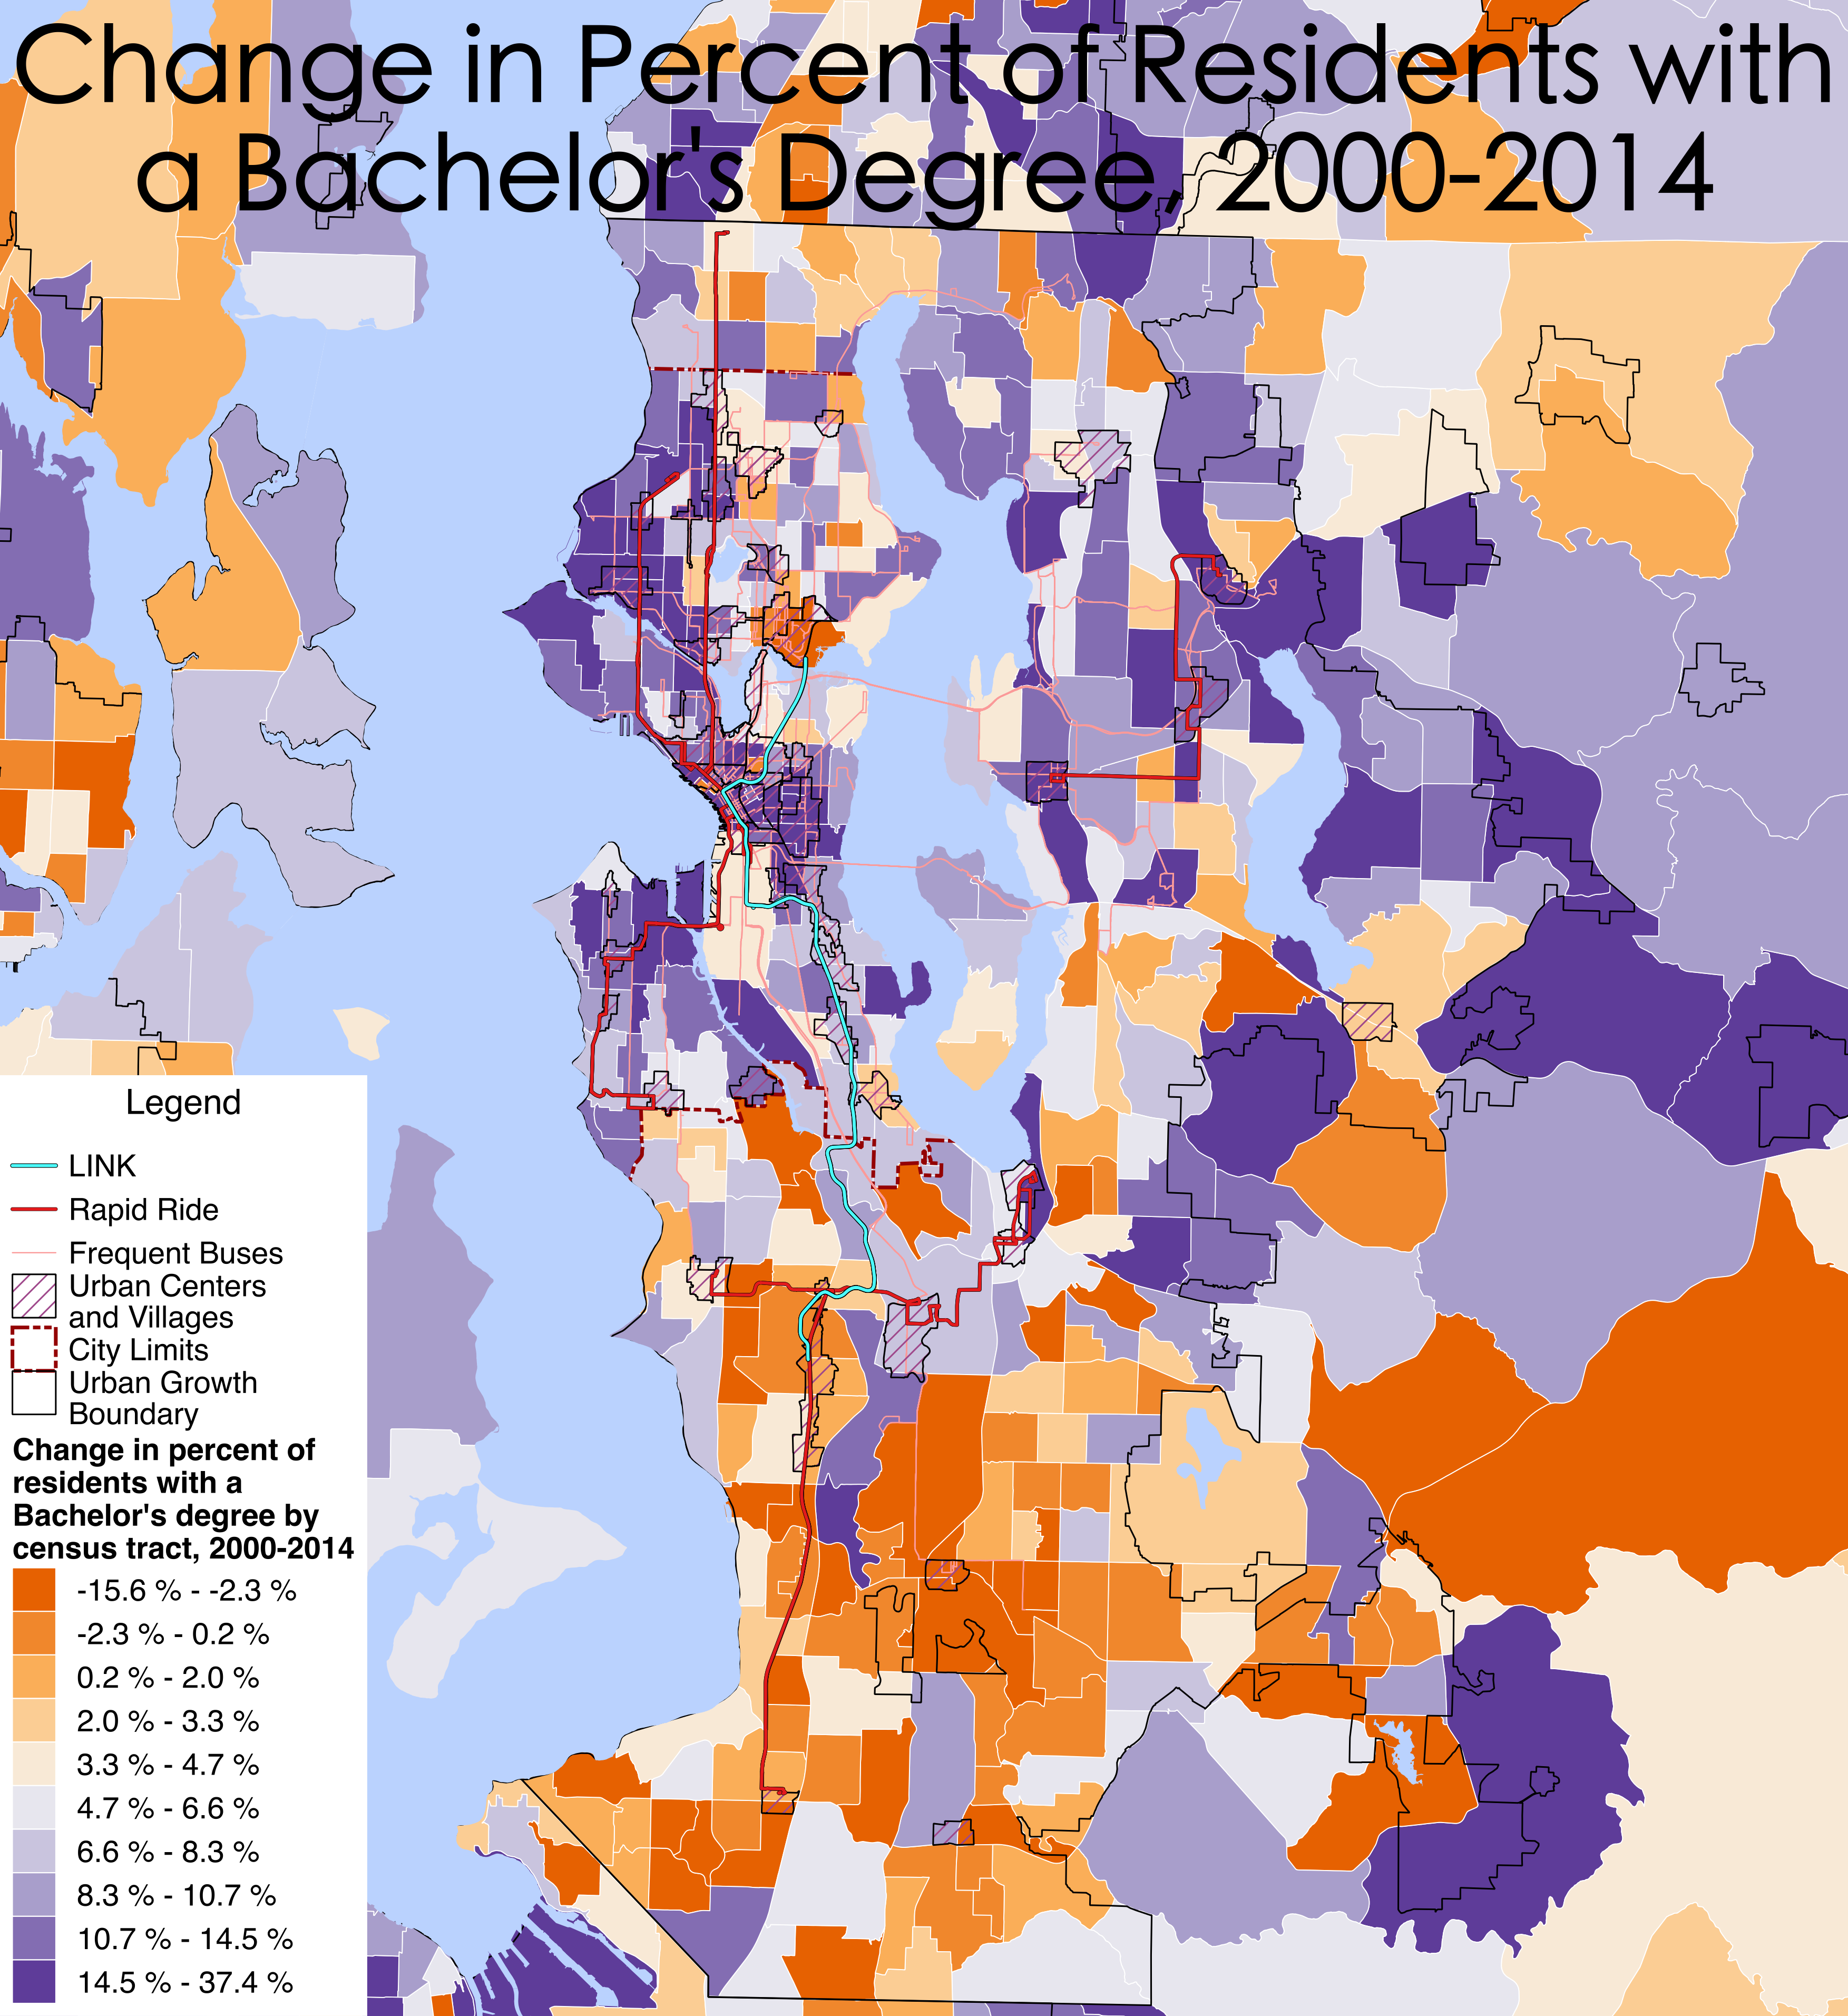
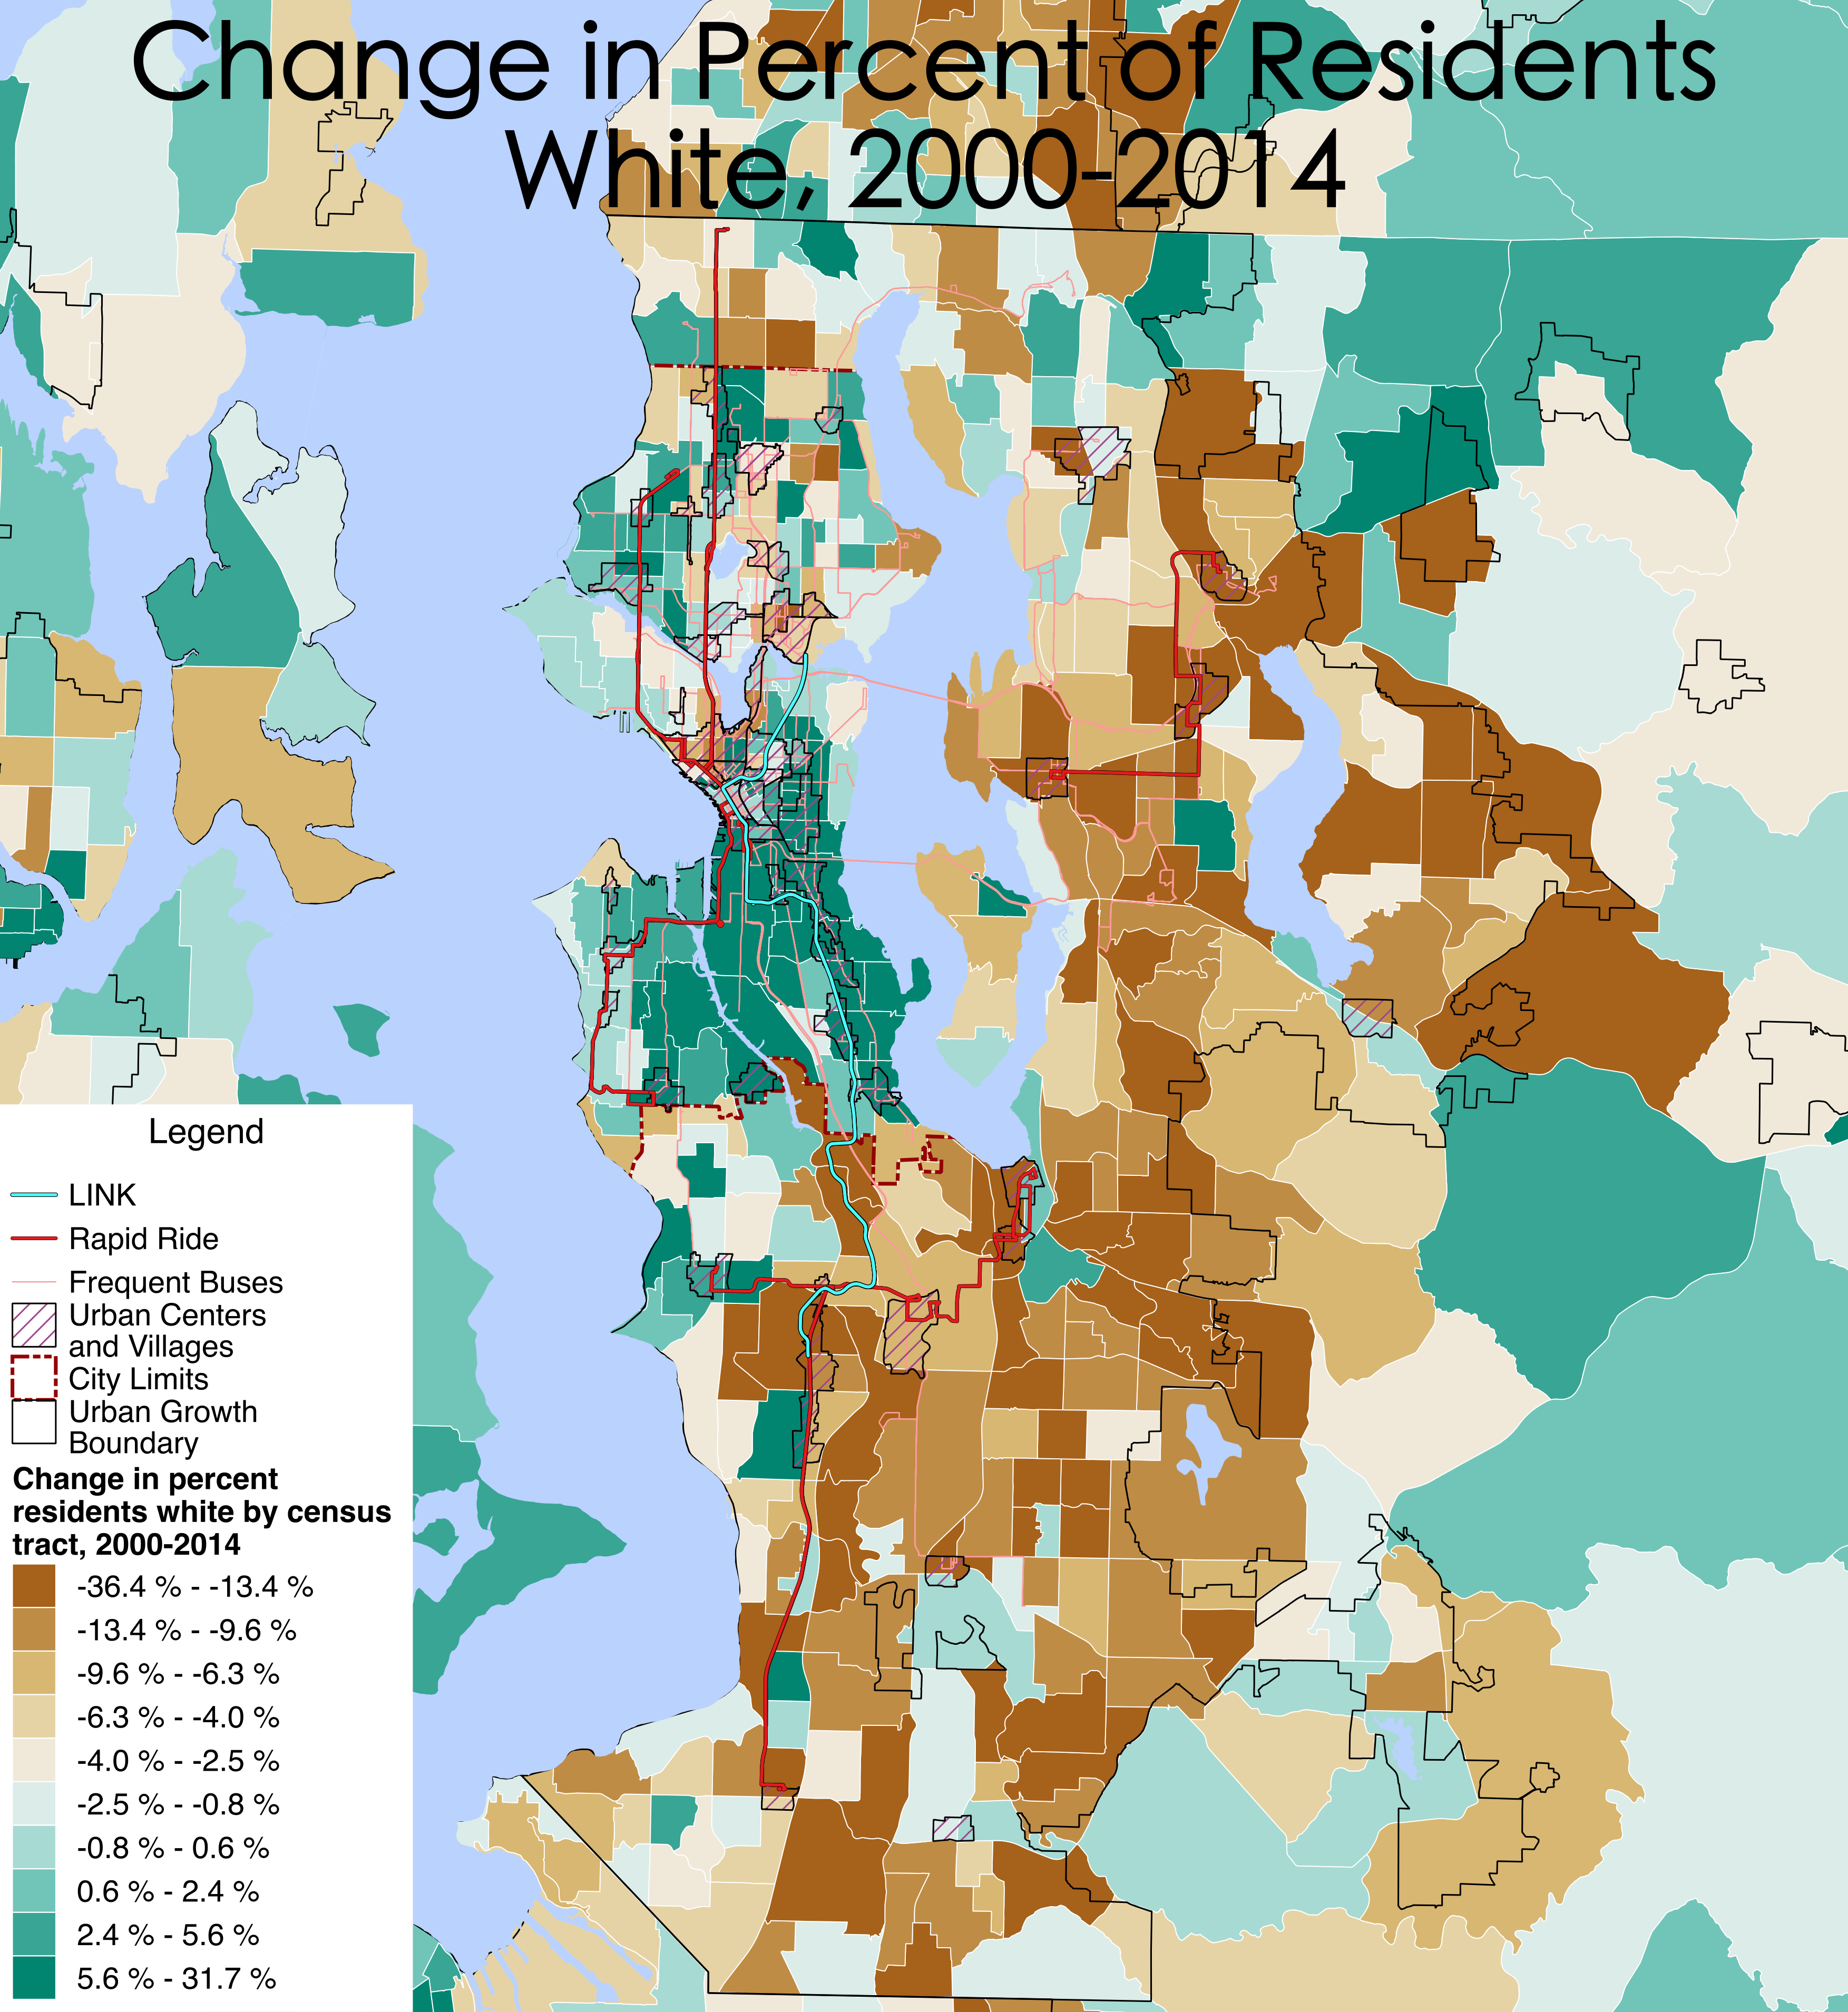
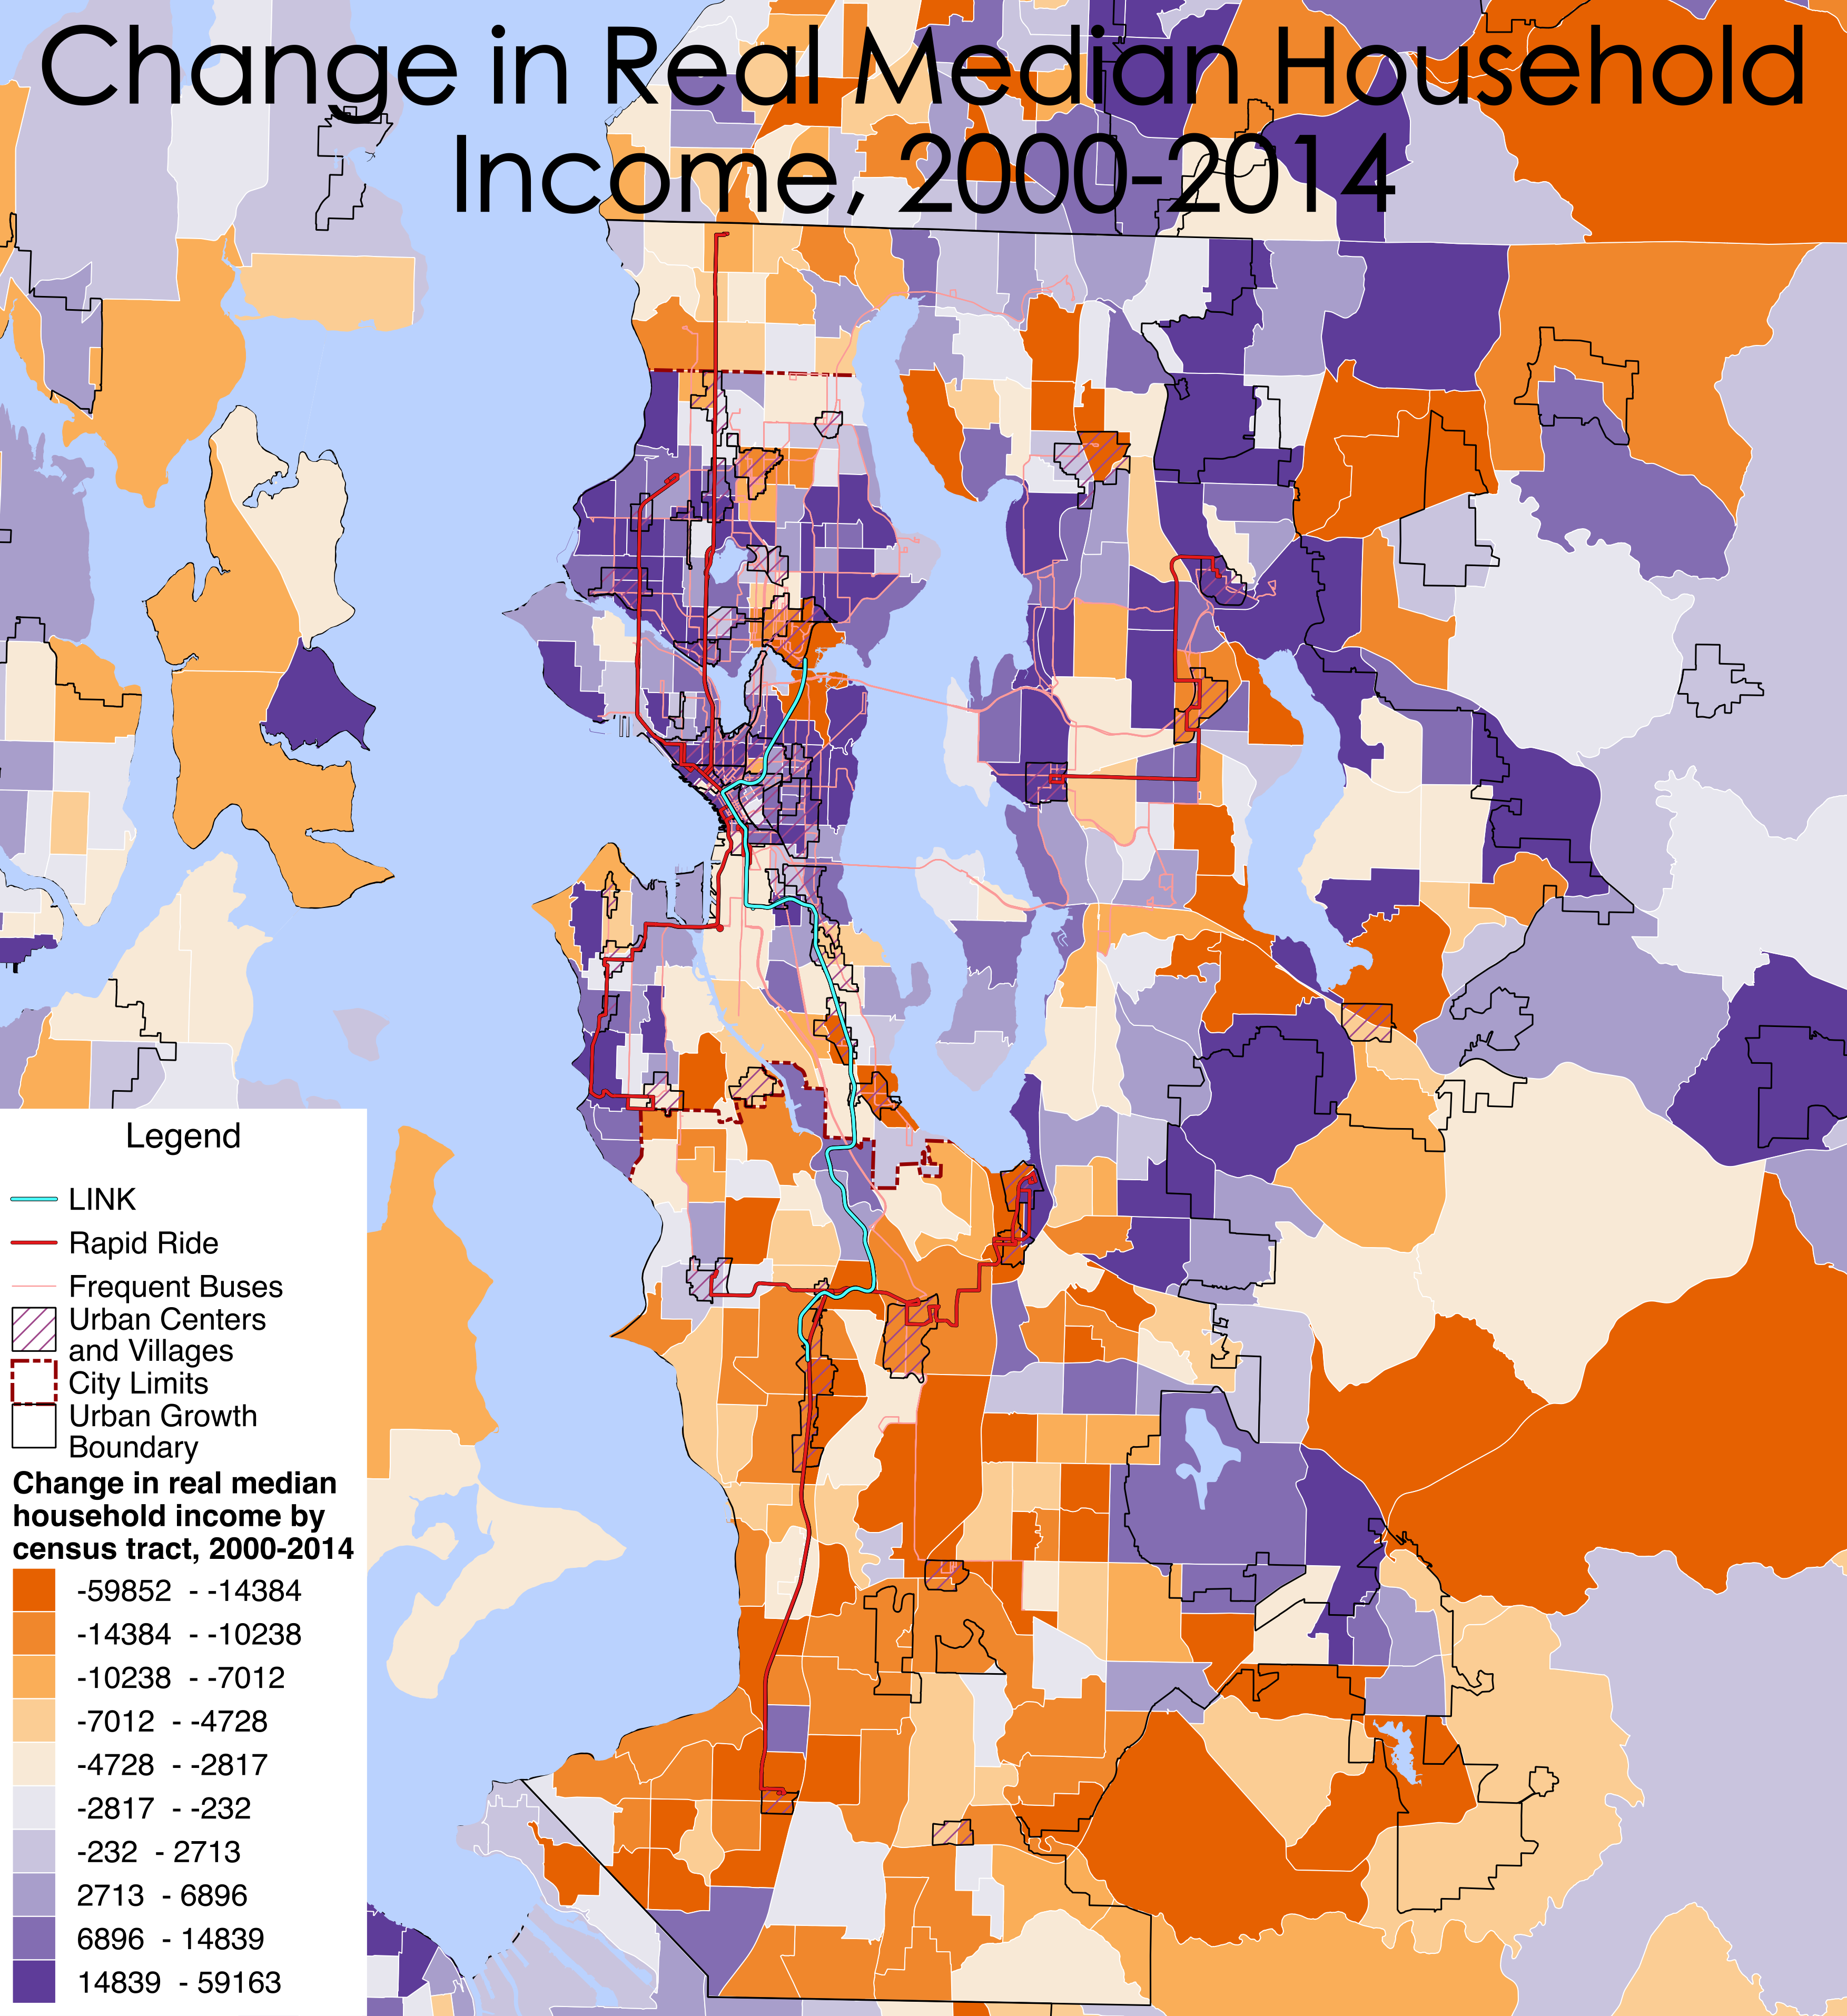
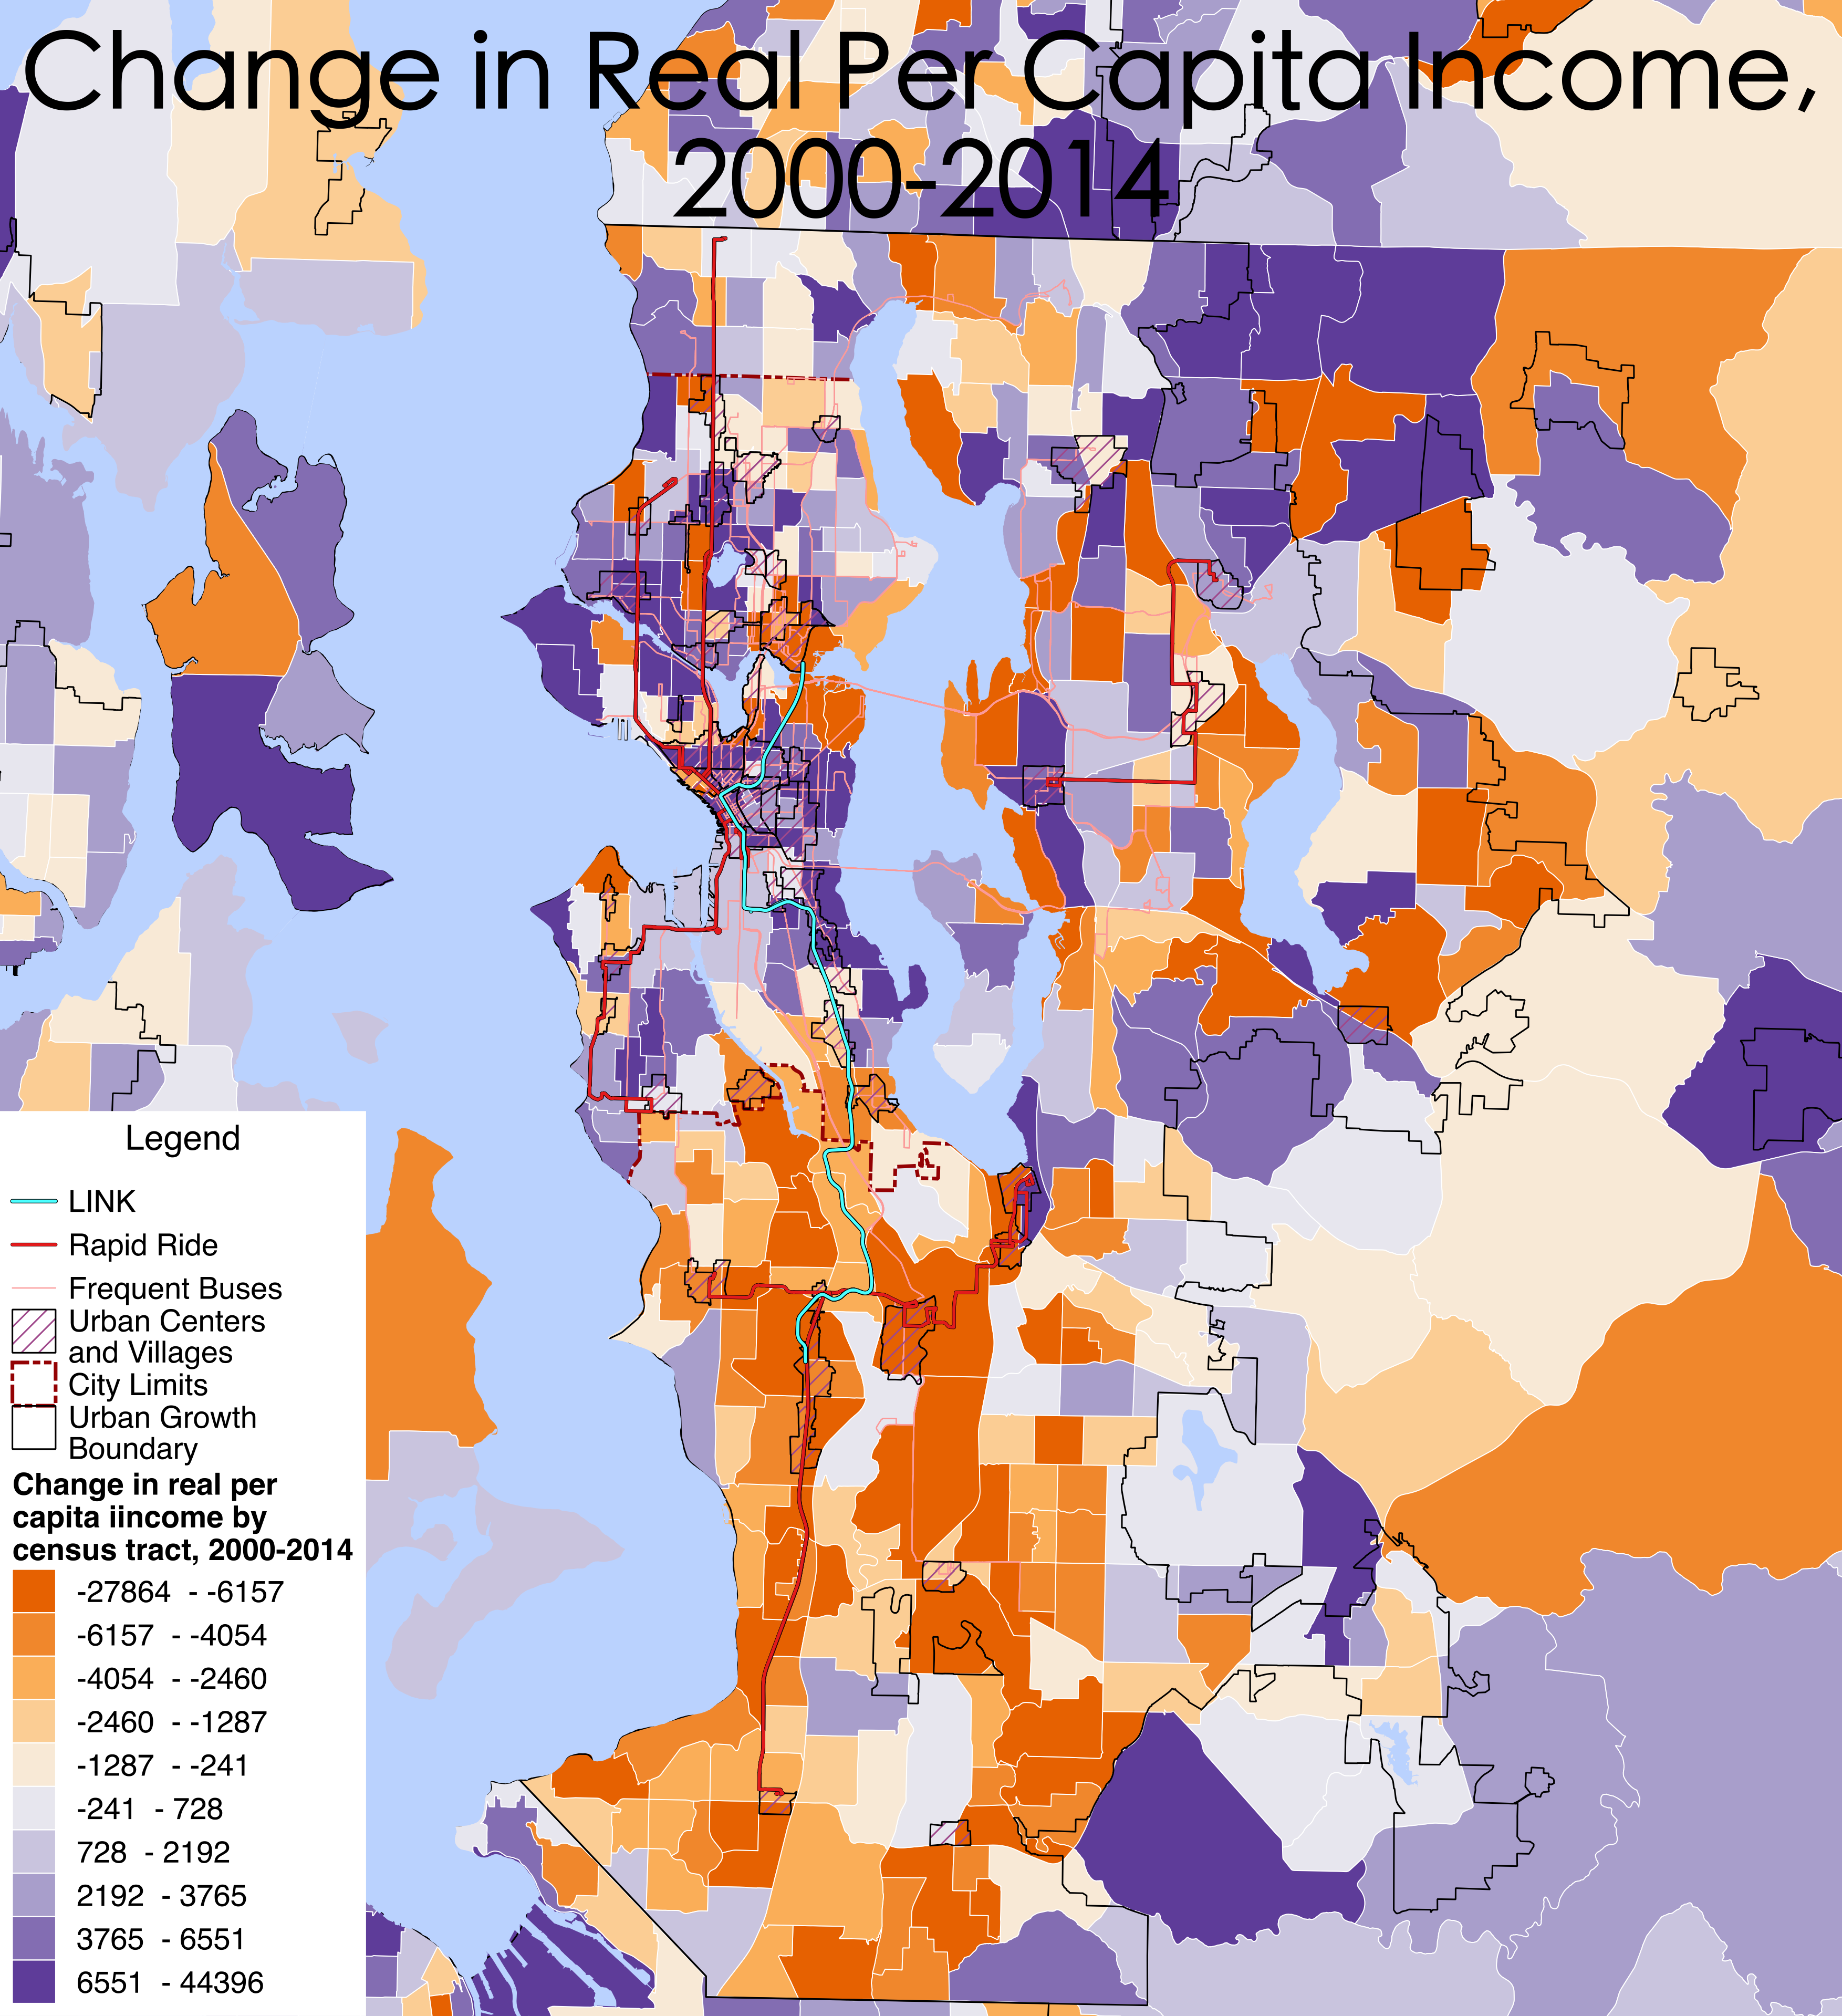
Gentrification is (partially) indicated and constituted by an increase in the socioeconomic status of residents of an area, as the previous residents are replaced and displaced by the influx of capital and newcomers. In terms of quantitatively assessing this shift within U.S. cities, the standard data for such analysis involves the U.S. census/American Community Survey data on percent of residents with college educations, median household income, income per capita, and racial demographics. The US2010 project adjusts data from past censuses to current census tract boundaries, providing an indispensable source for such a longitudinal analysis. Below I’ve plotted the change in these key variables for King County from 2000 to 2014, with the legend ranges set to contain an equal number of census tracts within the metropolitan region (King, Pierce, Snohomish, and Kitsap counties). They reveal a broad pattern of increased socioeconomic status within Seattle itself and on the Eastside, while South King has seen a large influx of poorer, less-educated, minority residents. The image of racial change is somewhat distinct from the other three indicators; the traditionally minority tracts of South Seattle have whitened to an extent exceeding that of their income/educational increase, while the Eastside has seen a large increase in its Asian population. I’ve plotted this against the current transit network to highlight the spatial relationship between this class-upgrading/gentrification in King County.
For the purposes of analyzing gentrification dynamics, I clipped the census tract extents to the urban growth area in King County. I then calculated the distance between the center of each census tract and the nearest frequent transit stop, in order to run a basic statistical analysis of the correlation between this demographic data and transit proximity. Below is a table of the bivariate correlation between a number of socioeconomic and demographic variables and the distance to the nearest transit stop. Statistically significant relationships in which proximity to transit was positively correlated with the variable in question are bolded, while statistically significant negative relationships are italicized.
[table]
,Pearson Correlation,p-value,
Change in Households 2000-2014,.15,.003,
Change in Population 2000-2014,.14,.004,
2014 Population Density,-.33,.000,
Change in Population Density 2000-2014,-.15,.004,
2014 Household Income,.18,.000,
Change in Household Income 2000-2014,-.12,.019,
2014 Per Capita Income,-.03,.493,
Change in Per Capita Income,.02,.751,
2014 College Educated,-.21,.000,
Change in College Educated,-.17,.001,
2014 Percent White,.31,.000,
Change in Percent White,-.08,.127,
[/table]
This highly aggregated and coarse analysis reveals some interesting differentiation between the socioeconomic variables in terms of type and whether they are static or longitudinal. First, transit proximity is presently negatively correlated with both household income and percent of residents white, though it is positively correlated with education—despite the fact that income and percent white are positively correlated with education (R=.64 and .44, respectively). Suburbanization as a mobilizing discourse is essentially dead in Seattle, as the region contemplates a new $50 billion light rail package, to follow the $20 billion package passed eight years ago. Most suburban locales, including Issaquah, Bellevue, Lynnwood, and Kirkland, have themselves (at least nominally) accepted smart growth as their development framework, implementing lofty plans for creating new mixed-use, transit-oriented urban landscapes from acres of light industrial or strip commercial land. As a reality, however, suburbanization in the region continues at the metropolitan fringe, hard-up against the urban growth boundary. These contradictory dynamics are expressed by the opposite correlations found for population growth by tract and population densification as it relates to transit (R=.14 and -.15). Additionally, though transit access is negatively correlated with household income as of 2014 for King County, the change in household income since 2000 is positively correlated, indicating a metropolitan restructuring of affluent households towards transit.
Leave a Reply