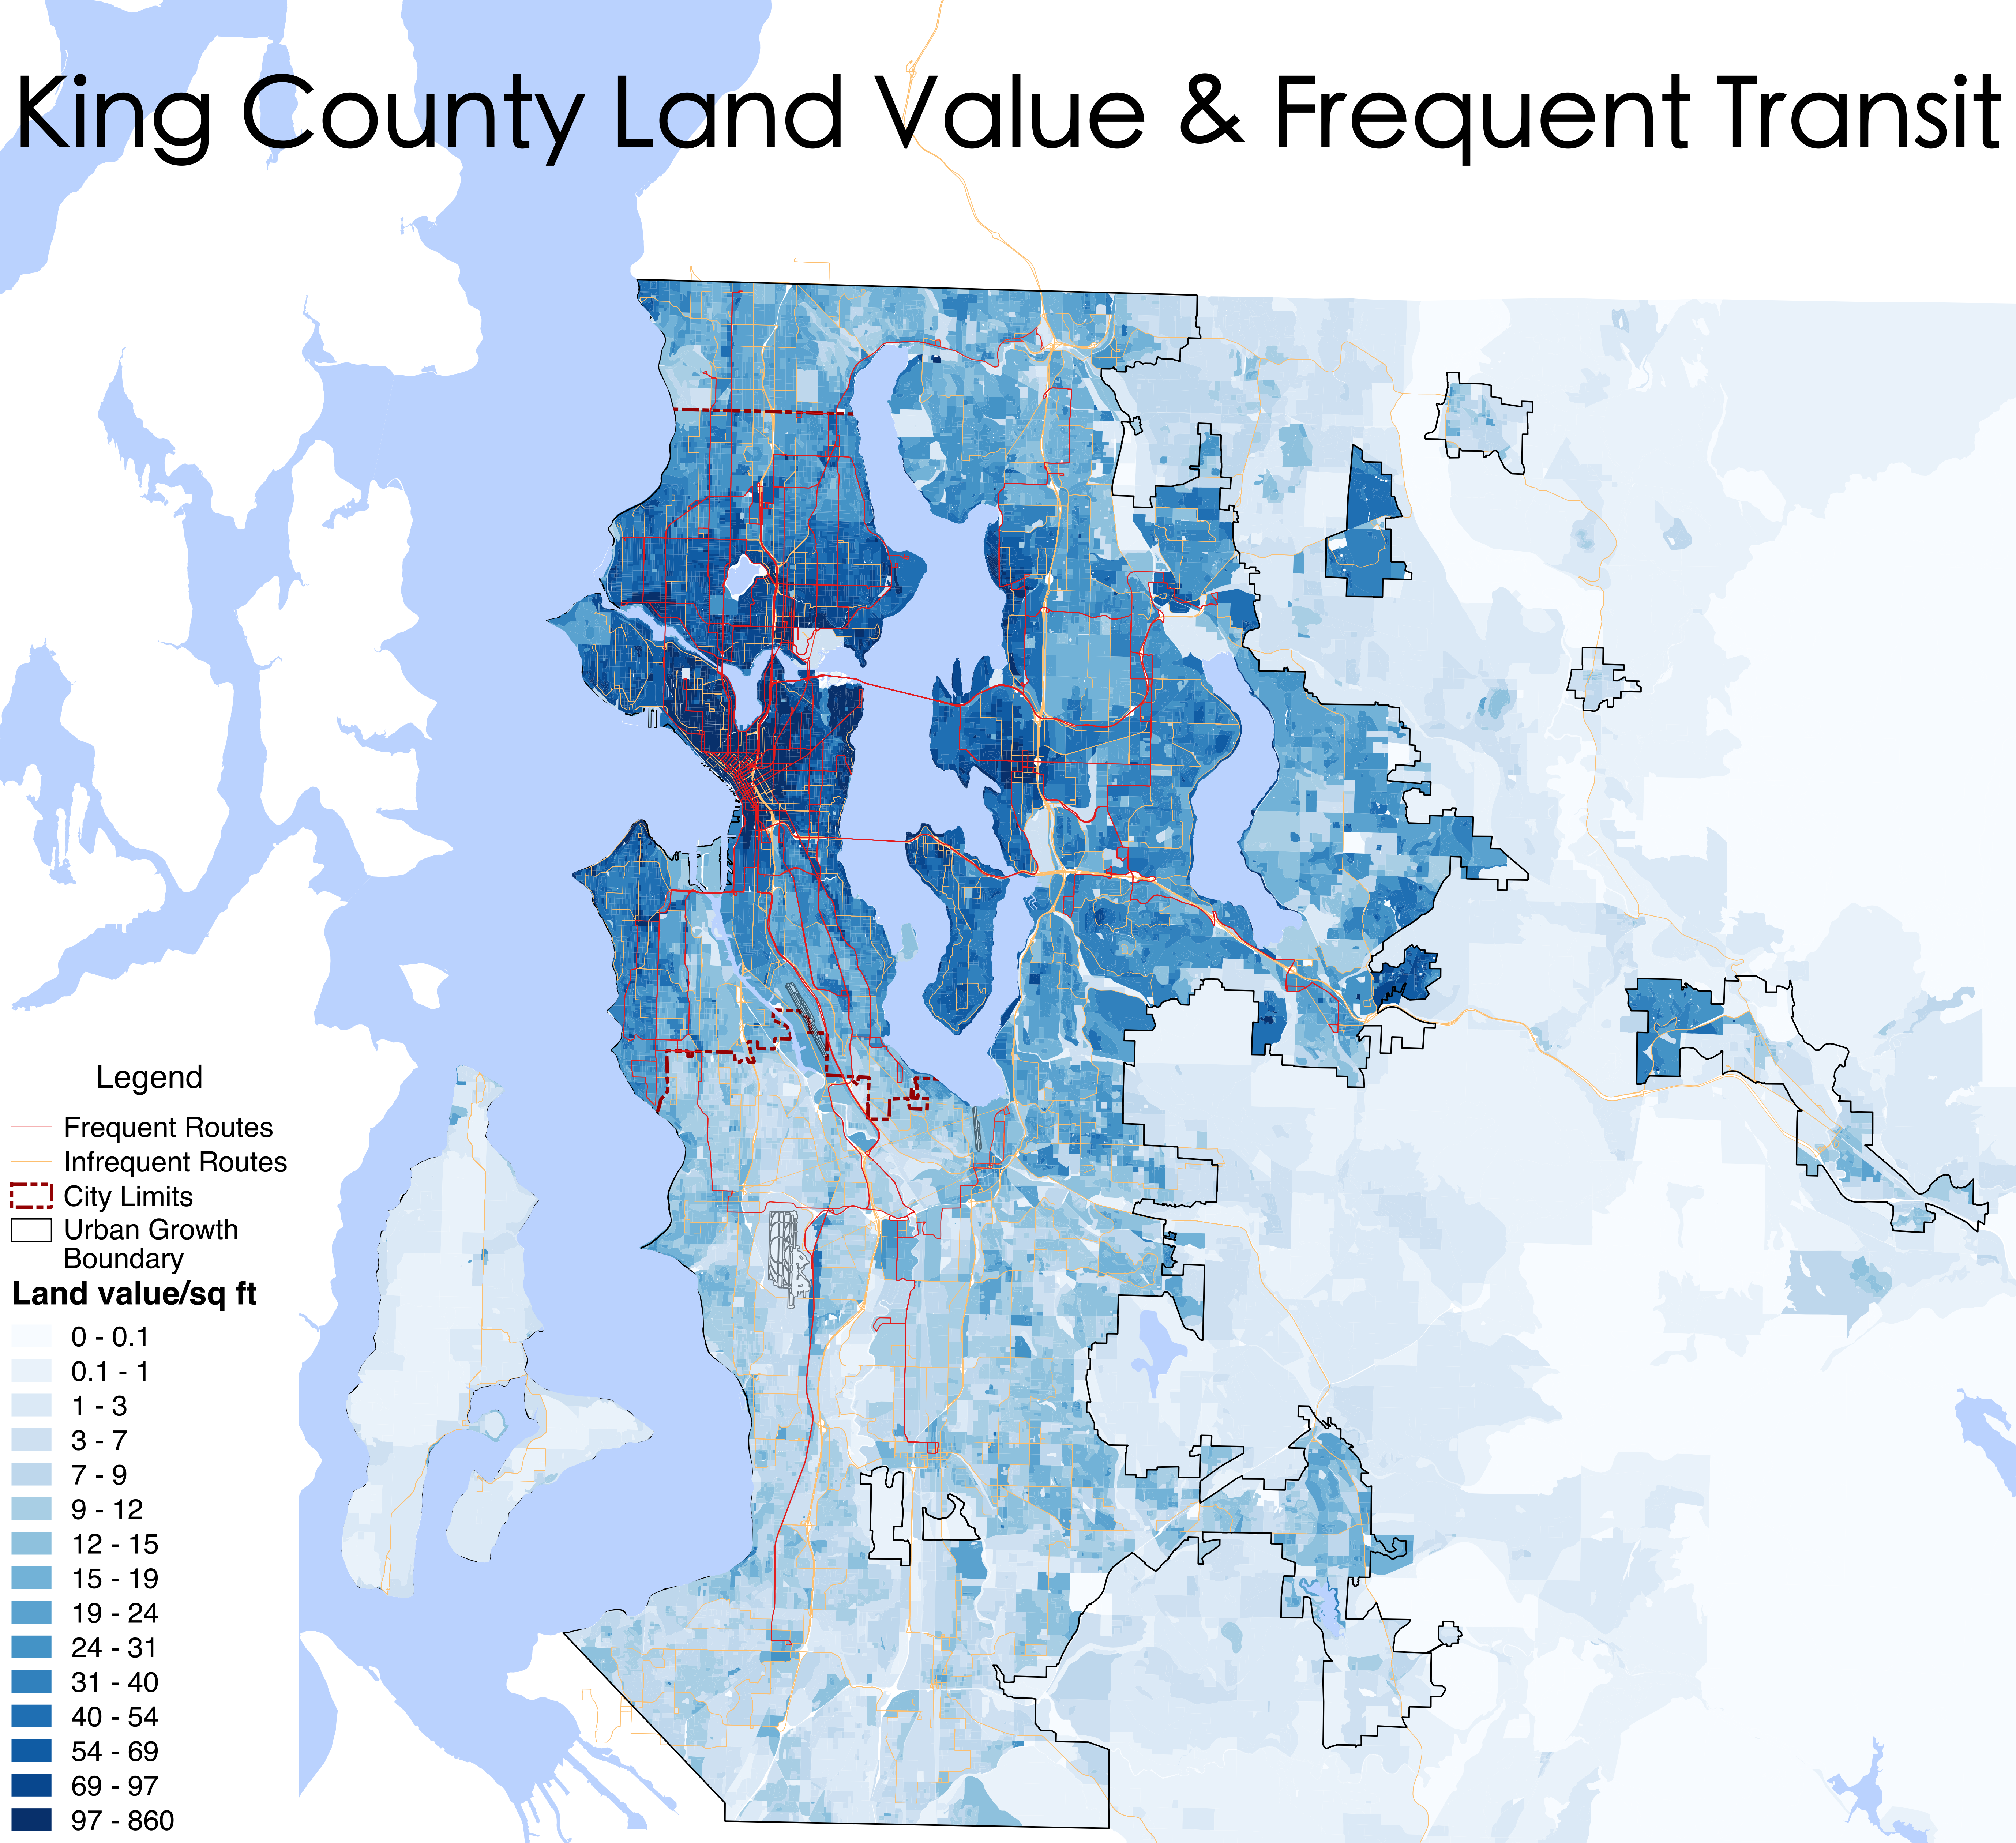
As part of my continued work on my concentration, I’ve compiled maps of land value in Seattle and frequent transit stops, posted below. The land value data is freely available from King County’s GIS center, as is the data on transit stops. Unlike Portland, however, Seattle doesn’t provide a handy “frequent” categorization for these stops, so I had to manually highlight and delete stops along infrequent routes, using the Seattle Transit Map as a guide. Further complicating the categorization of bus stops are Metro’s practice of combining two routes into a frequent trunk, with an infrequent tail to cover more of the city in lower-density outlying areas, and its practice of having an infrequent tail attached to an otherwise frequent route (with, say, half the trips turning back at different end point). I’m using land value here for the same reasons as I used it in my independent study—as a fundamental indicator and shaper of gentrification dynamics.
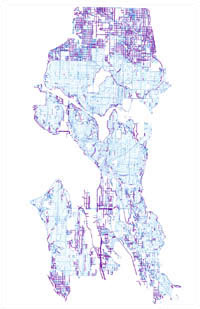
Sidewalks in Seattle; purple indicates no/incomplete sidewalks
Land values in Seattle are, unsurprisingly, highest downtown, in other relatively central neighborhoods, and in waterfront neighborhoods. There are spikes in land value visible in most designated urban centers and along commercial corridors served with transit. There are also a few stark dividing lines in terms of land value in Seattle; 35th Avenue in West Seattle divides the middle-class and lily white streetcar suburbs to the west from the more-recently built, diverse and lower-income neighborhoods to the east; 85th St/95th St serve to demarcate the divide between the inner and outer northside, with the land value maps essentially reflecting where the sidewalks end. Even now, after twenty to twenty-five years of gentrification, the Central District still has undervalued land, relative to values seen directly to the east and west. Regionally, the affluent Eastside cities and suburbs have relatively high land value, while the South King suburbs appear substantially devalued. Overall, land value within Seattle seems correlated to the density of the transit network, though the suburban picture is far less clear, with relatively highly valued blocks at the metropolitan fringe and lower-valued ones in South King, even along transit.
To analyze the present correlation between transit and land value, I ran a linear regression on three independent variables—distance from block center to the nearest frequent transit stop, distance to the center of the downtown block with the highest land value, and distance to the closest point along the waterfront (excluding the industrially-dominated Duwamish River). For the whole county the results are:
[table]
,Median Value,LN(Median Value),
Adjusted R Square,.25,.52,
Distance to Transit,B=.32 p=.000,B=.19 p=.000,
Distance to Downtown,B=-.71 p=.000,B=-.86 p=.000,
Distance to Water,B=.00 p=.571,B=.00 p=.488,
[/table]
Within Seattle,
[table]
,Median Value,LN(Median Value),
Adjusted R Square,.30,.45,
Distance to Transit,B=-.09 p=.000,B=-.11 p=.000,
Distance to Downtown,B=-.51 p=.000,B=-.58 p=.000,
Distance to Water,B=-.18 p=.000,B=-.36 p=.000,
[/table]
I excluding blocks with a value below $1/sq foot, as those blocks are entirely underwater, parkland, or undeveloped land and irrelevant to an analysis of gentrification. I have the analysis for both nominal land value and of the natural logarithm of land value (as the relationship between transit/centrality and land value appears curvilinear. After accounting for these variables, transit proximity has a statistically significant effect both countywide and within in the city. The direction of this relationship is opposite, when comparing the relationship within the city and countywide. Holding the other variables equal, within the city, land value decreases by 0.09%/0.11% for every 1% increase in distance from transit, while for the county as a whole, land value increases by 0.32%/.19% for every 1% increase in distance from transit. This is basically reflective of the situation in the suburbs, with South King receiving substantially more frequent transit stops than East King. It also provisionally supports the notion that transit’s relationship to land value is shaped by the dynamics of city-based gentrification.
Obviously, this analysis is incomplete without longitudinal land value data. I’ve managed to find some historic assessment data, but it’s complete crap as formatted, with large swathes of lots left blank. I’ll need to go back and check through the City of Seattle’s website for a more complete data set.
In addition to this data-based work, I’ve found some good sources directly pertaining to gentrification in Seattle. Richard Morrill’s chapter, “Gentrification, Class, and Growth Management in Seattle, 1990-2010,” in Global Perspectives in Urbanization, addresses how growth management/smart growth and a directed municipal policy of urban infill constitutes a strategy of gentrification, resulting in the displacement of poor from “underutilized” areas. He begins by characterizing gentrification as being constituted by two similar, though mutually-supporting and similarly-constituted typologies. ‘A’ gentrification involves mass-scale reinvestment in the city core, while ‘B’ gentrification is the classic individual renovation of old housing near the city center and class upgrading and displacement. Morrill uses factor analysis to categorize each of Seattle’s census tracts according to subsets of these typologies.
Geoffrey Wentlandt’s 2003 thesis, “Unraveling Gentrification and Neighborhood Reinvestment: Lessons From Seattle During the 1990s” argues that neighborhood reinvestment and gentrification are two distinct and separable processes. He defines gentrification as the replacement of people and reinvestment as the replacement of the built environment. I disagree with this characterization on definitional grounds, as, drawing on Smith and Morrill, I see gentrification as a broad class process constituting elements of displacement (of people) and reinvestment (into the built environment).
I furthermore have some problems with Wentlandt’s methodology. To bolster his argument, he categorized a select group of tracts in Seattle as either gentrifying or not, on the basis of demographic data (outflow of low-income households, inflow of high-income households, influx of professionals, and influx of advanced degree holders above the citywide median) and survey data. He categorized Roosevelt, Lake City, Beacon Hill, and the International District as his “control” non-gentrifying group, even though all of the neighborhoods experienced an outflow of low income households, with Beacon Hill and the International District experiencing an outflow well beyond that of the citywide median. Beacon Hill and the ID also experienced a huge outflow of non-English speaking households (22.9% and 31.8%, respectively), while Lake City and Roosevelt experienced an influx of advanced degree holders above the citywide median. Wentlandt himself, in establishing a control group of non-gentrifying tracts, notes how “a number of neighborhoods shared the type of results indicating weak levels of gentrification.” These control groups are used, however, to indicate that neighborhood reinvestment (as measured through mortgages) is not correlated with gentrification—again, despite the fact that all tracts observed experienced substantial outflow of the working class.
Leave a Reply