Well, I guess I lied a little bit about not doing anything further with the regression of the time series. I found out how to actually run the spatial lag and error models that I had read about in the hedonic literature through GeoDaSpace. These models incorporate a spatial matrix of the sales to correct for the spatial autocorrelation of prices and errors. The weight matrix I used was an inverse distance matrix, using the band distance suggested by GeoDaSpace. The spatial lag model incorporates a variable W_ADJ_PRICE, which is a function of the prices of neighboring home sales, accounting for the tendency of property values to cluster. The spatial error method uses the variable lamda to account for the clustering of errors deriving from having some unspecified spatial variables unincorporated in the model. Despite the neighborhood fixed effects I incorporated, Moran’s I and other spatial correlation tests revealed some remnant spatial effects. The results of the spatial lag and error model (2SLS) are presented below, alongside the OLS results.
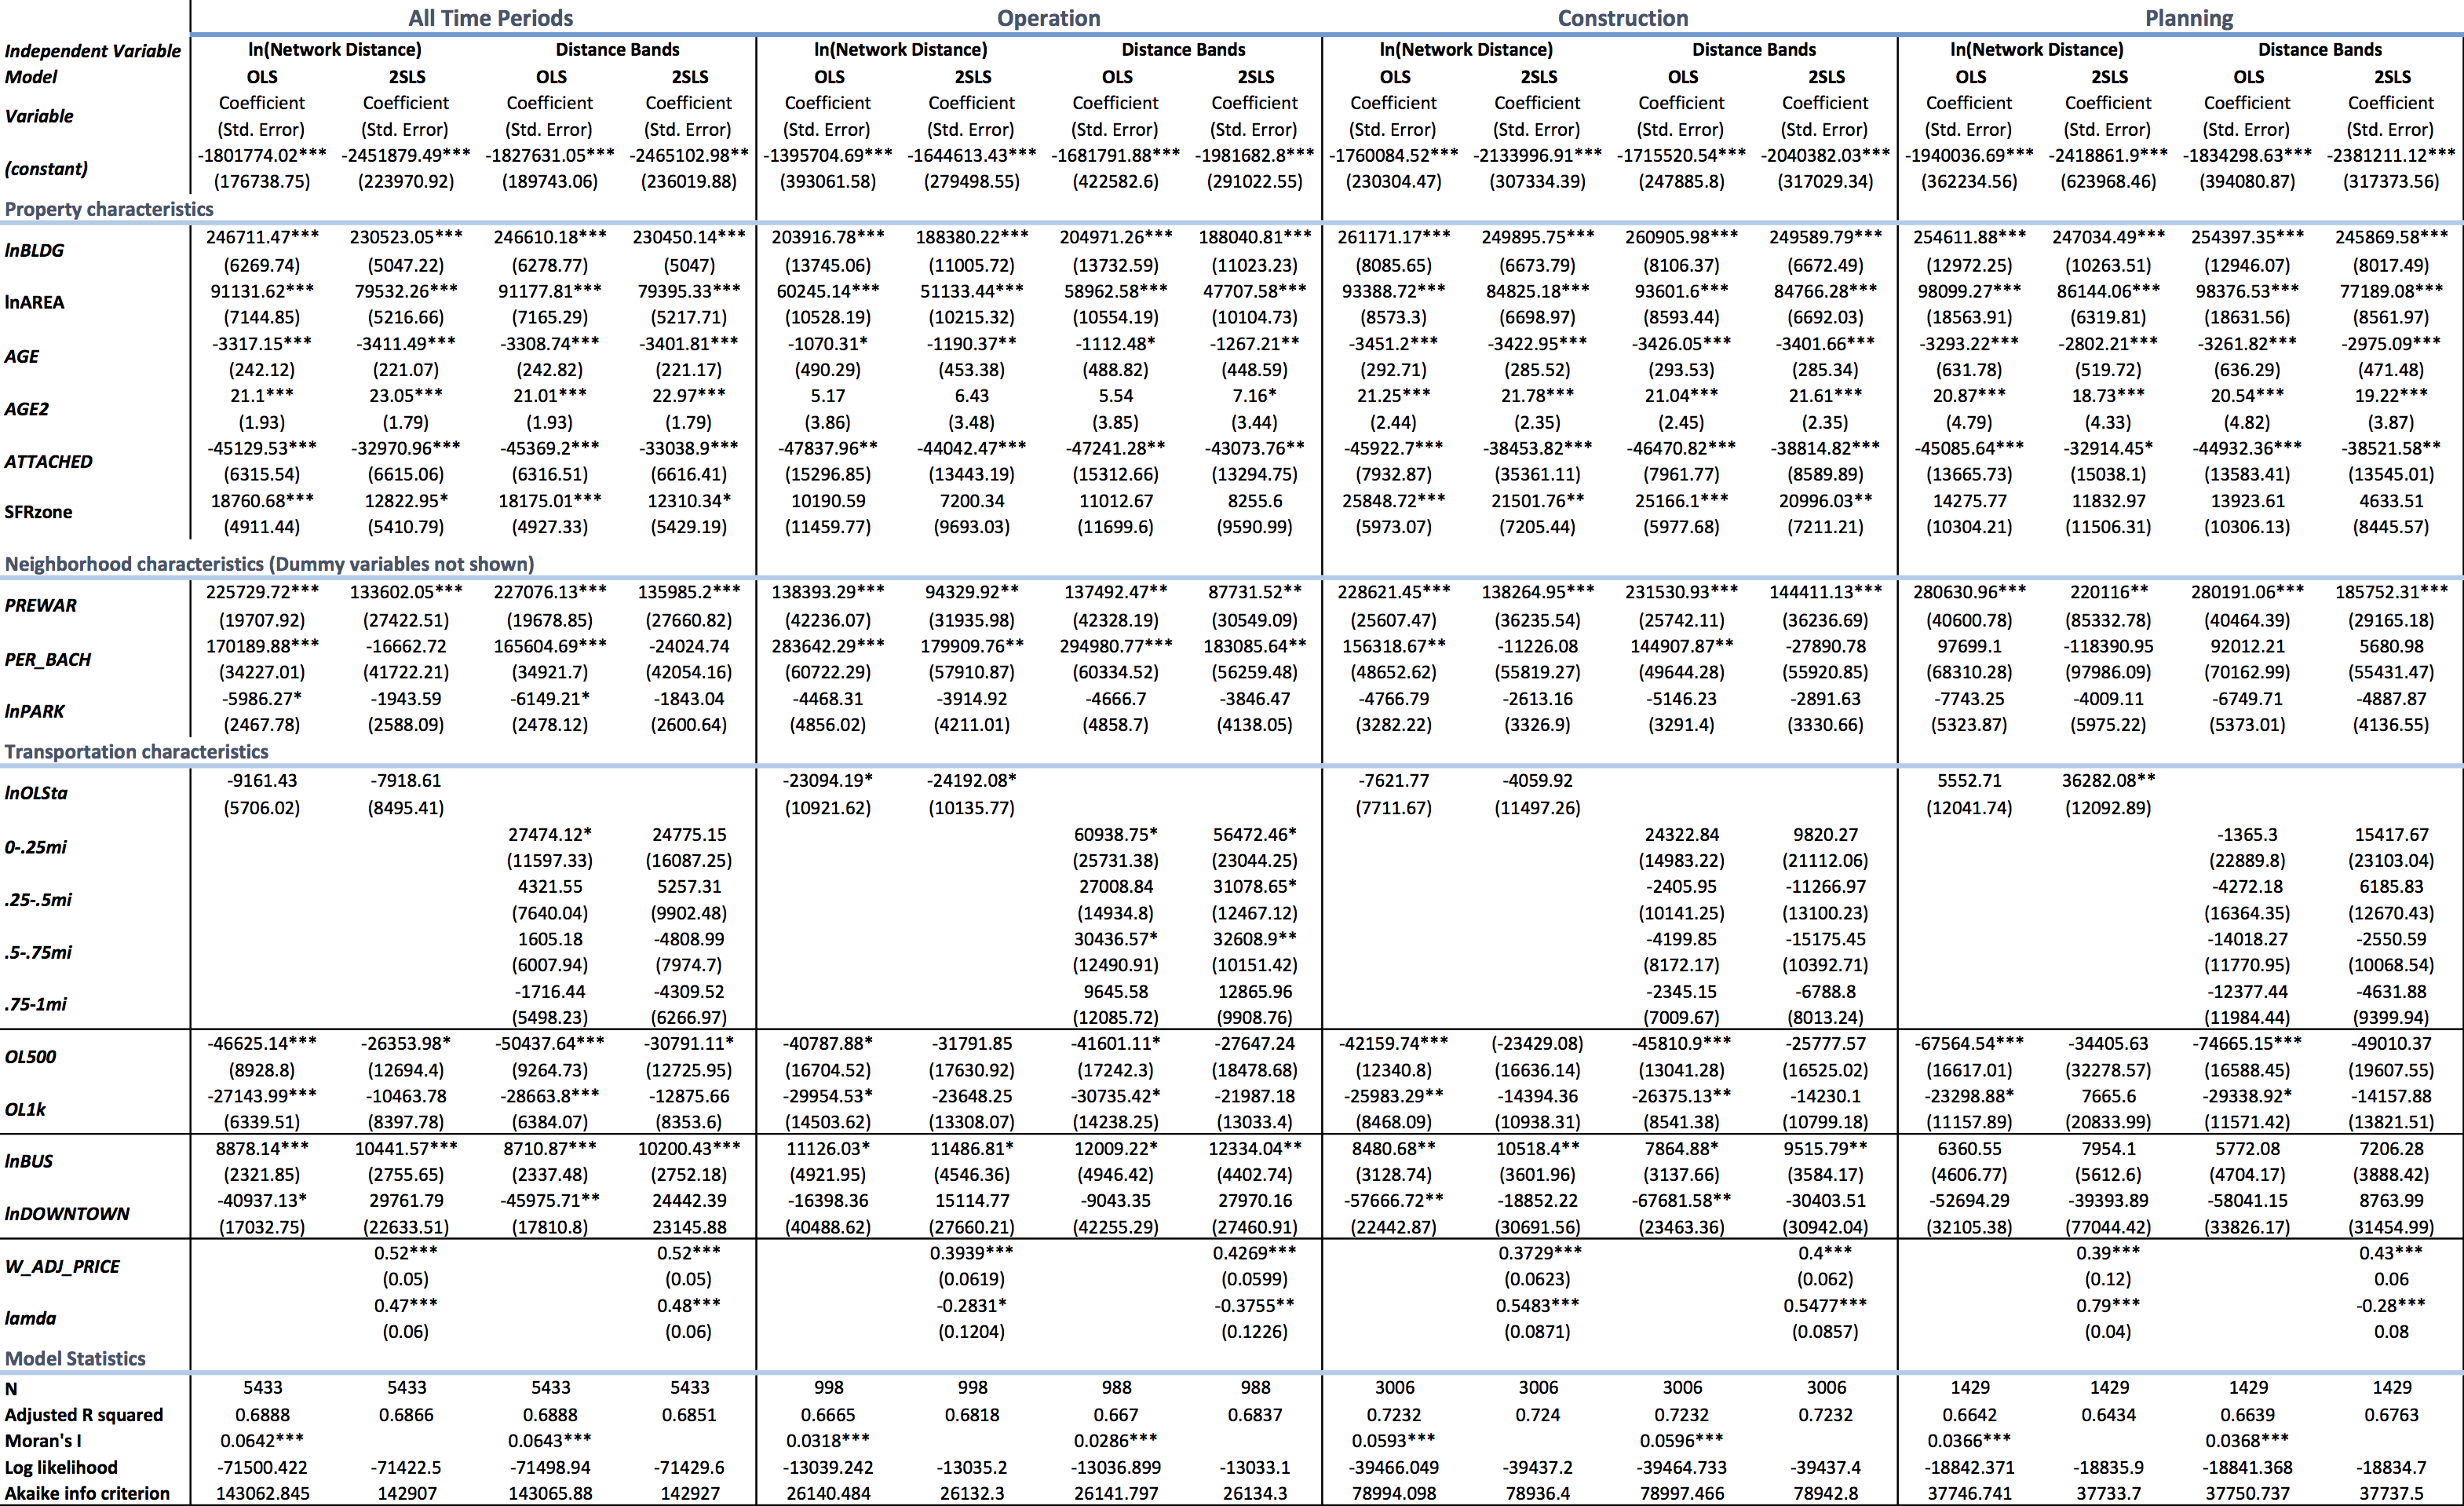
*p<.05; **p<.01; ***p<.001
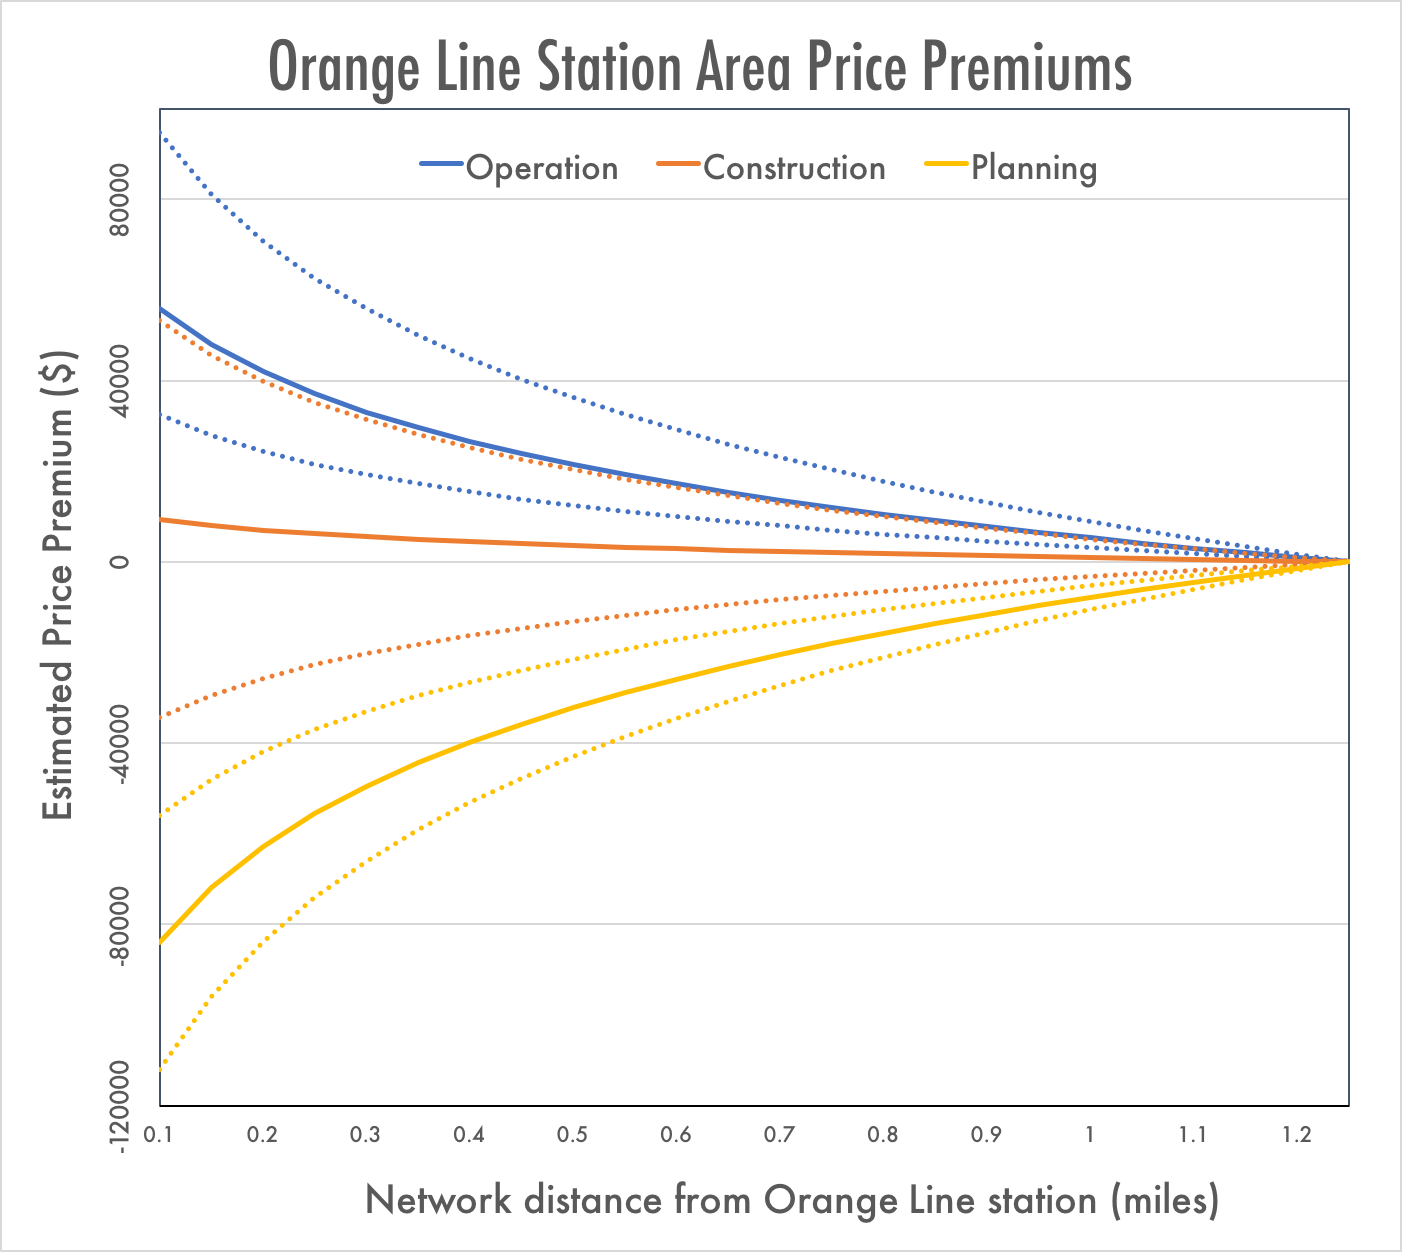
By and large, the two models produce similar coefficients and significance levels for each of the key variables. The size of the discount applied to proximity to the future light rail corridor during the planning period is somewhat suspect, given the lack of significance found for any of the distance bands, so I can’t feel confident in that particular result being accurate. Nevertheless, the accordance of the 2SLS model with OLS as to the size and significance of the planning period premium enhances my confidence in the overall finding of a substantial increase in home prices with the opening of the Orange Line. I additionally updated the bid rent curve graph to reflect the 2SLS results; they seem generally somewhat more robust than the OLS model, as shown through Log likelihood and AIC stats.
More substantively, this week I created the model of the individual station areas. These smoothed bid-rent curves for the network as a whole elide significant distinctions. Rail networks are not spatially homogenous—both the utility of stations and the attractiveness of their environments vary widely. Hess and Almeida (2007) and Kittrell (2012) studied the price effects of light rail by individual station, finding dramatic variation in the relationship to prices along the same transit line. To investigate this potential spatial heterogeneity and help ground the econometrics in the localities of planning and equity, I conducted an individual station regression analysis. To do so, I split the sales data by the nearest station, excluding OMSI/SE Water Ave due to a lack of observations (N=9). I then ran a regression of each of these datasets, using a singular model specification developed on the dataset as a whole that eschewed the neighborhood dummy variables and distance band specifications used in the time series analysis, as these would be woefully error-prone given the small sample sizes. I also included the immediate proximity to buses and highways out of a need to improve the overall variance explained. I kept all variables within the model for the sake of consistency. For station areas revealing significant spatial autocorrelation, as measured through the significance of Moran’s I, I ran the spatial lag and error model. The results are summarized below, organized in order of their location along the line, with the leftmost stations being closest to/in downtown and the rightmost stations being at the line’s terminus.
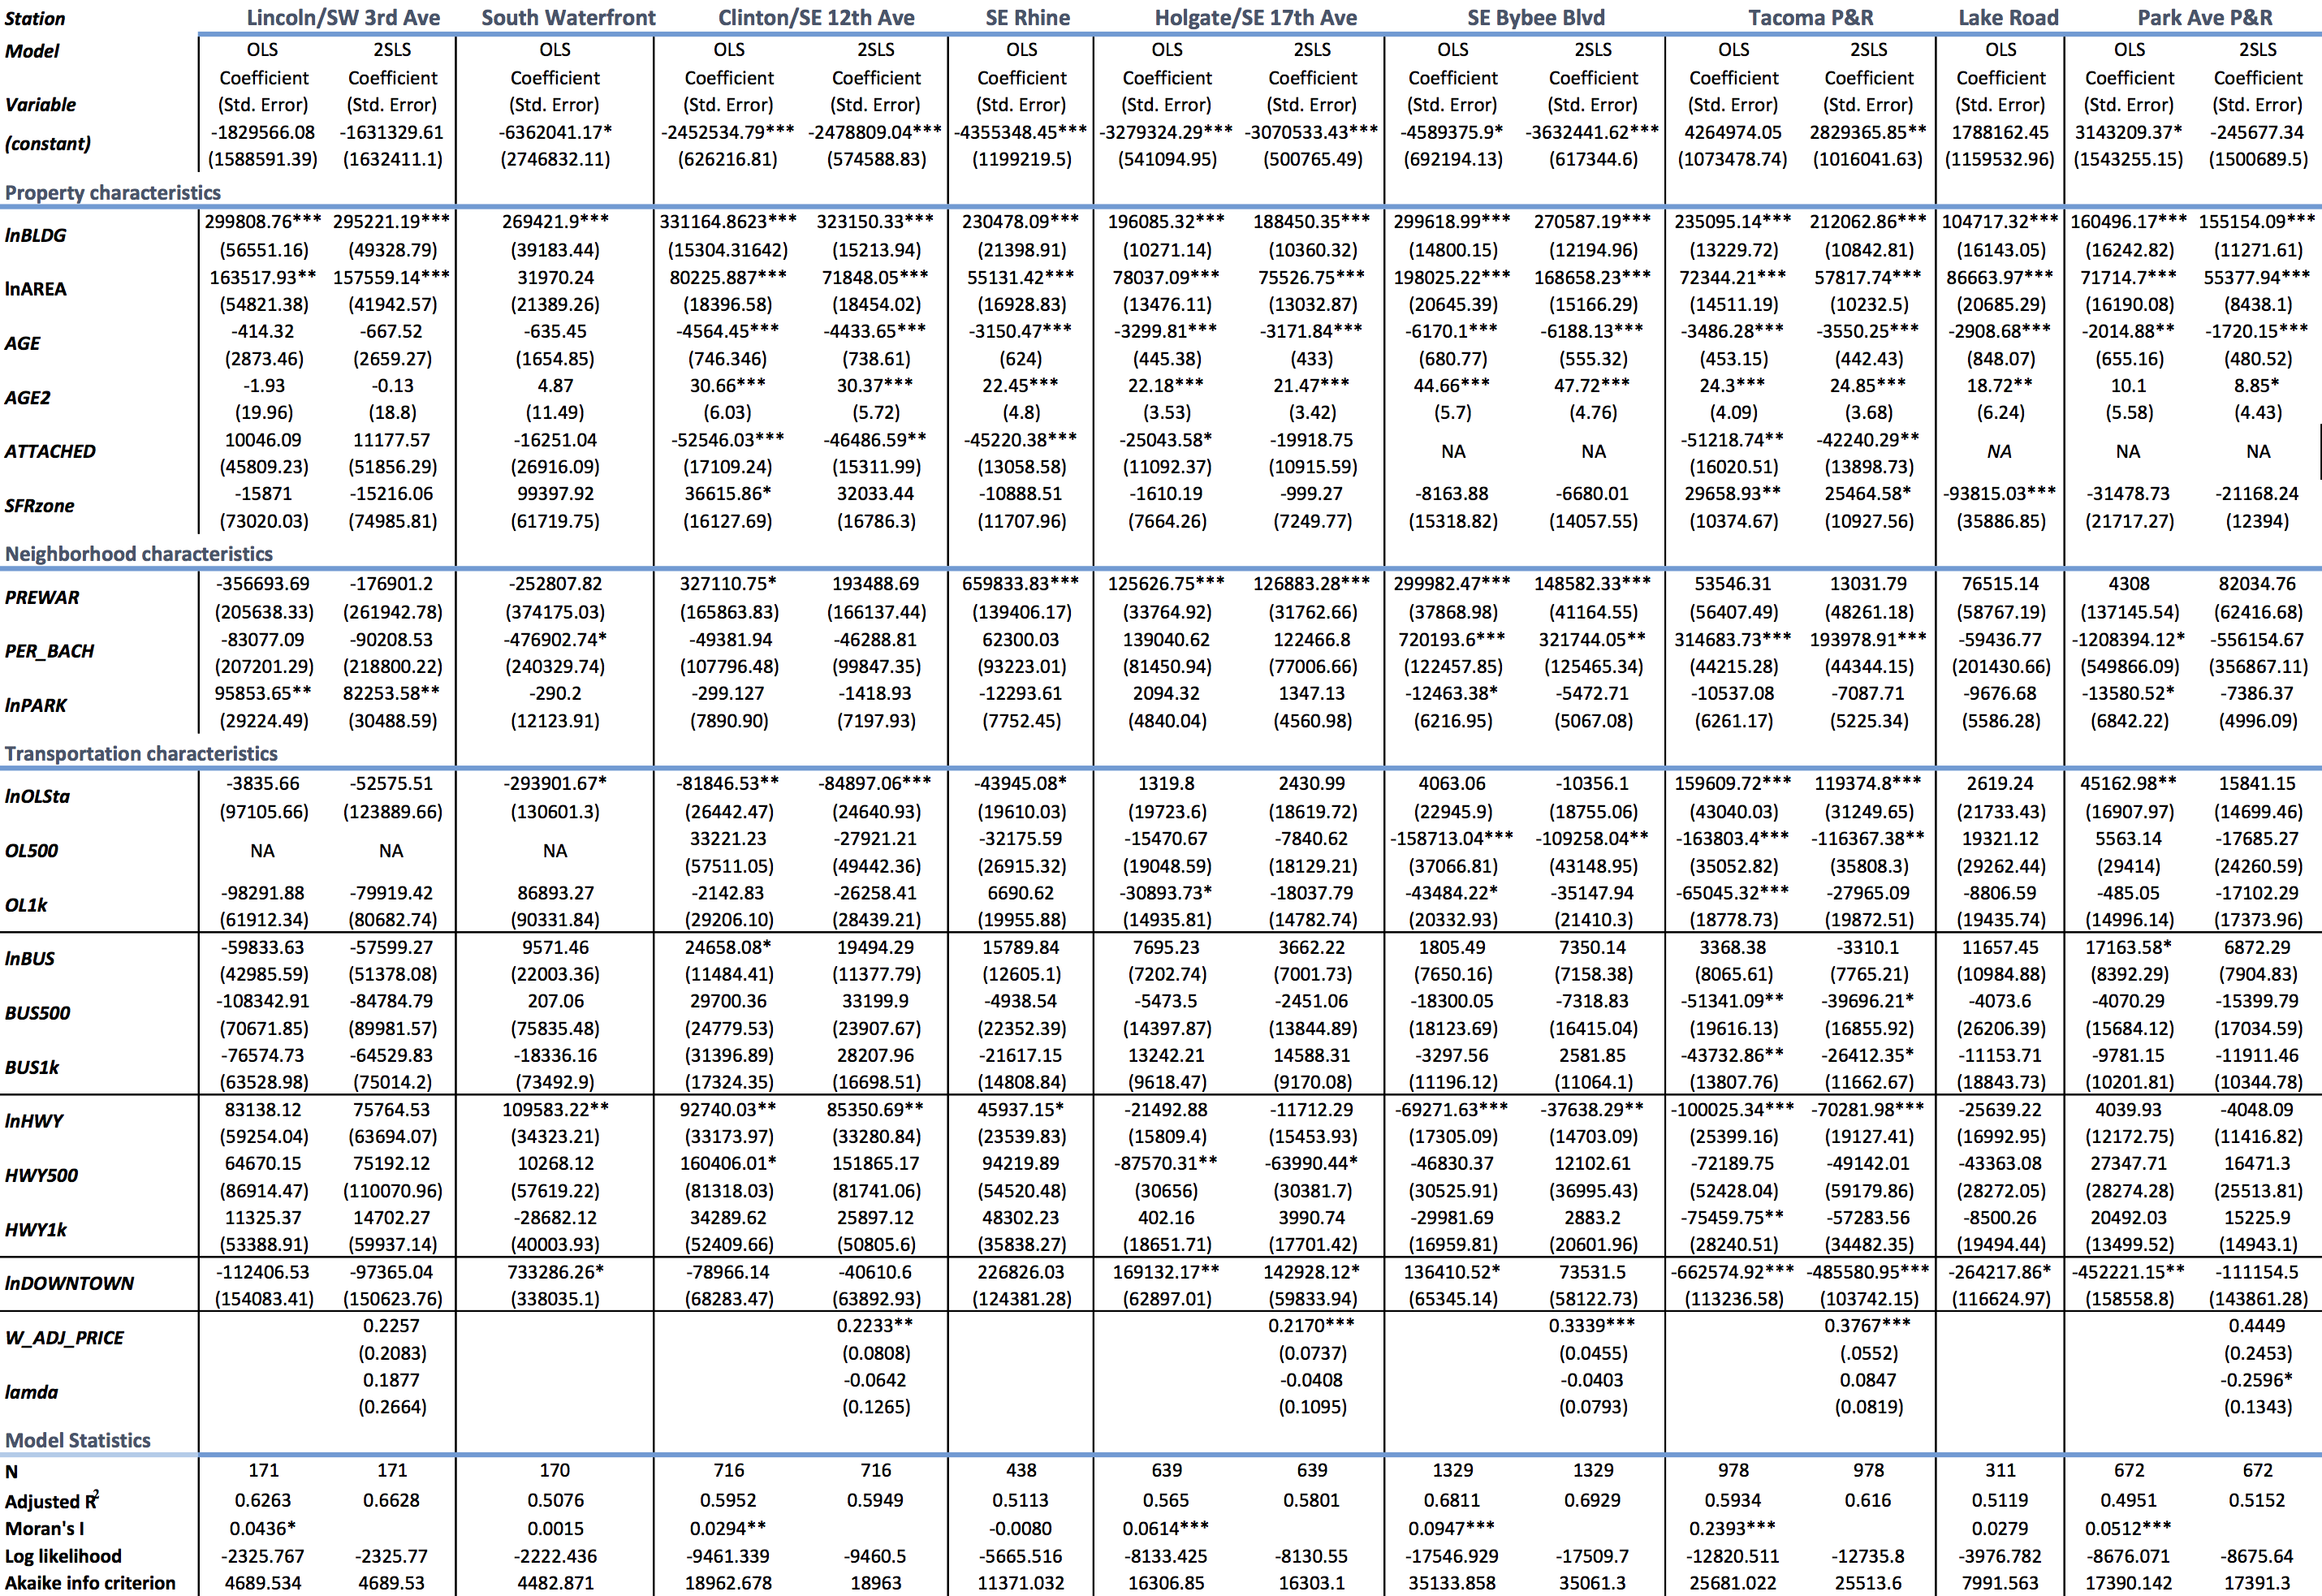
The significance of the overall results is, rather predictably, lower than that for the larger datasets, while errors are enhanced. Estimation of the station-specific price premiums was hampered in large part by the limited sample size available. Given that the time series analysis indicated that Orange Line station locations have only recently been capitalized into land markets, it is perhaps unsurprising that a majority of the results were statistically insignificant. Restricting the analysis to sales within the operation period was not a viable option, as it would reduce the observations for many stations below 100. Despite this limitation, statistically significant effects were found for four stations by both models: a transit-premium for the South Waterfront ($2,500 increase with a 1% decrease in distance), Clinton/SE 12th Ave ($810-$840 per 1% decrease in distance), and Rhine/SE 17th Ave stations ($440 increase per 1% decrease in distance) and a disamenity effect for the SE Tacoma Park & Ride ($1,200-$,1600 decrease per 1% decrease in distance). OLS estimates also found a negative relationship between proximity to the Park Ave Park & Ride and home prices ($450 decrease per 1% decrease in distance), though the 2SLS estimate was not significant.
These results are roughly in accordance with expectations. Kahn (2007) found a disamenity effect of park and ride stations and an amenity effect of walk and ride stations, so the results for the Tacoma P&R accord with his results. Given the media coverage of Milwaukie’s suddenly hot housing market and rapid revitalization of downtown, fed in part by light rail, the lack of a premium for the Lake Road station is somewhat surprising. The number of observations here may be a limiting factor, along with the aforementioned issues with not delimiting the time period. Overall, the three stations returning statistically significant light rail premiums were the three closest stations to downtown (excluding OMSI), following the Lincoln/SW 3rd station by PSU. The robust price premium observed for the Clinton station is very interesting, as this station was highlighted in the preliminary station development planning process to present, by far, the most opportunities for development. The ‘triangle’ of industrial land adjacent to the station is also slated for significant rezoning with the ongoing Comprehensive Plan Update, going from industrial to a central employment designation, with 65 foot height limits and no restrictions on use. Deca Architecture, working for the City, put together a station area development opportunity plan that championed the wholesale transformation of the Clinton station area, employing the ubiquitous language of New Urbanist and Jane Jacobs-inspired developer visions:
This report envisions the Study Area as a live/work village full of activity during working hours and at night. At present, the area is chiefly industrial, so its daytime population is scanty, and it has virtually no eyes on the street at night. Redeveloped as a mixed-use area, the Study Area can realize its potential for desirable density. Reborn as a residential and creative office resource for Portlanders, the area can become a safe, attractive place to live and work, with eyes on the street day and night in a new/old location with its own unique, appealing character.
The rendering of the future station area reveals no trace of the present industrial uses, to be replaced by vaguely European-styled mixed uses, glimmering with affluence.
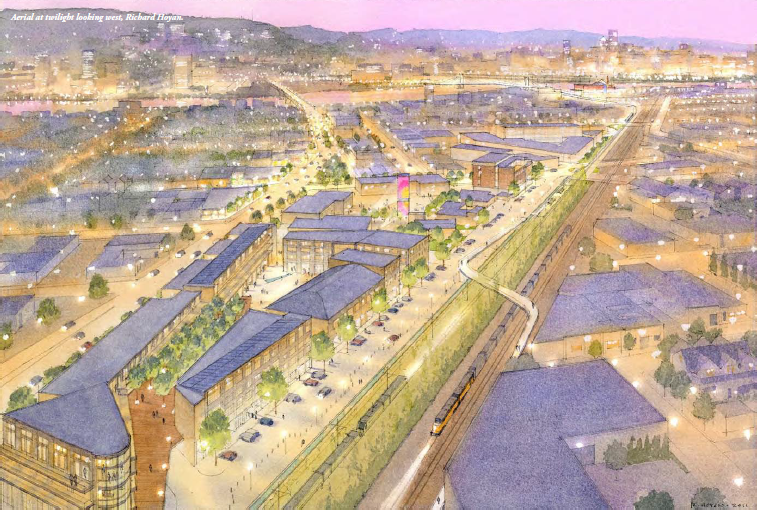
Source: DECA Architecture
Overall, my qualitative investigation into planning process and documents of the Orange Line has not yet been quite as extensive as I had hoped, with regression analysis taking far more time than anticipated. Thus, I will have to perform more of this research over break and early on next semester. I’ve read through many of the final reports associated with the line but have yet to peruse through the meeting minutes of the public advisory committee or the public comments on the Draft EIS. From this limited investigation, however, I can conclude that public engagement and considerations of equity were muted, along with a huge focus on the development potential of the stations. The process began with the rail alignment and station locations relatively set and was chiefly concerned with developing the EIS. The public engagement which occurred was largely informational, with TriMet seemingly feeling little pressure to even engage in mitigation. Perhaps some of the most notable public engagement on the station areas came with citizen workshops on the limitations of access to and attractiveness of the locations. These recommendations were used to promote specific capital improvement projects to maximize development potential.
The title of the final report on the Orange Line station areas,”Growing Places,” illustrates the general orientation of planning related to this light rail—the creation of place through the development encouraged by transit investment. In this model, development itself was treated as a benefit, at least as long as it was in line with the planned vision of mixed-use 4-6 story station villages. Reports emphasized projected employment and job growth in the vicinity while sidelining the ridership estimates. Ridership has, indeed, been somewhat disappointing, averaging about 11,000 over 2016—comparable to a relatively well-used bus line, but certainly (not yet at least) reaching the level at which the capacity improvements of rail over buses become necessary. The transportation needs that the Orange Line was to fill were primarily projected induced needs—light rail would only become necessary with the growth planned alongside it. Consideration of the equity impacts of the Orange Line was extremely muted, with no discussion of potential gentrification or displacement from light rail. I had expected to find more acknowledgement of this potential impact, as the connection between transit and gentrification has risen greatly in prominence over the last decade, leading many transit agencies to incorporate some explicit housing equity policies within expansion plans. SoundTransit in the Seattle area, for instance, purposefully acquires excess property around light rail stations in the construction process and proceeds to sell off this land with the requirement to guarantee 80% of the units as affordable. L.A. and Boston transit agencies have similar policies in place. The scant sections where equity was mentioned typically phrased light rail as an unequivocal boost in outcomes for lower-income residents, noting the increases in transportation mobility for transit-dependent riders while sweeping aside the question of who would be able to afford to live close enough to benefit.
Leave a Reply