Expanding transit options is essential to the livability and economic vitality of our growing region, which is expected to add one million new residents, and nearly 100,000 new jobs within the project corridor, by 2030. The Portland-Milwaukie Light Rail Project is a vital element in the region’s strategy to manage growth and build livable communities. This project is about more than bringing high-capacity transit to under-served communities— it is also about helping communities envision and achieve their aspirations. Combining infrastructure improvements, quality design features and new transit-oriented development along the alignment will connect neighborhoods, encourage walking and cycling, and create engaging public spaces where people want to be. —”Growing Places”
Background
Gentrification has become a routinized process and impulse in cities, restructuring the geography of rents, class, and function. The revalorization of the center has progressively displaced the image and reality of the dilapidated “inner city.” This sea change in urban affairs has not been a spontaneous happenstance; it is rather the result of the interaction of policy with capital. In the U.S. context, the antecedents of gentrification lie in policies of the capital-switching moment of the early 1970s. The model of Keynesian public housing policies and suburbanization discursively shifted to a neoliberal model that emphasized the revitalization of the city by facilitating private real estate investments in the core. Municipalities lie at the center of this process of often played a key role in supporting large scale gentrification via a variety of strategies, including local modes of financing redevelopment with diverted property taxes, public capital investments in areas, zoning changes, and symbolic support.
Transit forms a significant piece of this gentrification puzzle, interacting with gentrification, land value, and development in several manners. First, it has the potential to directly shape the geography of land rents within a market—according to locational indifference theory, any accessibility benefits it provides should be priced into land. Transit is theorized to act as a centripetal force for economic development, enabling mobility in denser areas. Perhaps more importantly, transit is often employed as part of Transit-Oriented Development plans, permitting and encouraging intensified uses and raised land values. Similarly, transit investments are a major way for municipalities to illustrate commitment to an area. The transit-development nexus is championed with win-win language positing greater equity, improved environmental outcomes, improved public finances, and private profit, the relationship between prices and transit access troubling a potential contradiction in equity—those who benefit from transit those most may be displaced by its provision within a hot housing market.
Situated Context
In terms of urban planning, Portland must be understood as both emblematic of broader trends in urban development and exhibiting an anomalously high commitment to and identification with “sustainability” as an urban design concept. Portland’s history of tying development to transit through planning began with the 1978 “Nodes and Noodles,” formalized later as the Centers and Corridors around which the city would concentrate development. This connection between transit, planning, and development forms the landscape on which Portland has grown in the neoliberal era. The concept of transit-oriented development and center/corridor plans are far from unique to Portland, however, lying at the center of “smart growth” plans in general and deployed worldwide. Portland has experienced a high degree of gentrification, with rapid price appreciation seen since 1990 across the city, particularly in the historic streetcar suburbs to the west of 82nd Ave. The Orange Line also runs through Milwaukie, an inner suburb just to the south of Portland, and adjoining unincorporated areas of Clackamas county. Downtown Milwaukie dates to the interurban era, with a core town area that has been the locus of recent revitalization measures; the rest of the city is predominately post-war suburban. The planning of the Orange Line was pervaded by the language of real estate investment, with its station area plans chiefly concerned with orientation so as to maximize redevelopment potential. The raison d’etre of the Orange Line was to create transit demand, not follow it.
Data and Methods
To analyze the potential price effects of the introduction of light rail, I conducted a hedonic analysis of home sales within 1.25 miles walking distance of each of the stations that occurred between 2008 and 2016. I examined these sales with respect to both the timing of the sales and by the proximity to individual stations. I created three time periods for the stations—planning (January 1st, 2008-June 30th, 2011), construction (July 1st, 2011-September 11th, 2015), and operation (September 12th, 2015-October 27th, 2016—and conducted the ultimate regression on each period, along with the time period as a whole. The beginning of construction on Tilkum Crossing was chosen as the demarcation point between planning and construction, though designs had not been completely finalized by that point. The primary data source used for this analysis was the County Assessor’s records of property sales, building area, and lot square footage. This is relatively sparse in terms of structural characteristics for hedonic analysis of home prices—most are conducted with commercial data from Metroscan and thus contain information on the number of bedrooms and bathrooms, presence of a garage, view, fireplace, pool, or air conditioning, and building condition. This may introduce error into the model and diminish its variance explained. I performed some data validation as described here to correct errors within the public dataset.
I calculated the key independent variable for my study—network distance to stations—using the Network Analyst tool in ArcGIS. The street network was obtained from Metro’s RLIS Discovery, altered to remove controlled-access freeways and add trails and a new pedestrian bridge. I chose to measure walking/network distance for theoretical reasons which were particularly relevant for examining the case of the Orange Line. Euclidean distance will always underestimate the distance one must travel to reach a point using the street network; this underestimation is compounded with poor street connectivity and barriers. The hypothesized price premium of transit is generally considered to be a function of people valuing the accessibility benefits of transit (Higgins and Kanaroglou 2016), benefits accessed through the extant street network. Given that the Orange Line runs largely in an old freight rail right-of-way, alongside a large golf course, and near the Willamette River, these considerations were particularly important. To specify the corridor boundary of 1.25 miles network distance, I largely turned to the existing literature. A ~1 mile Euclidean buffer for studies using a continuous-distance variable is typical (c.f Duncan 2008; Yan et al. 2012; Atkinson-Palombo 2010); a 1.25 mile network buffer approximates this distance while accounting for significant geographic barriers.
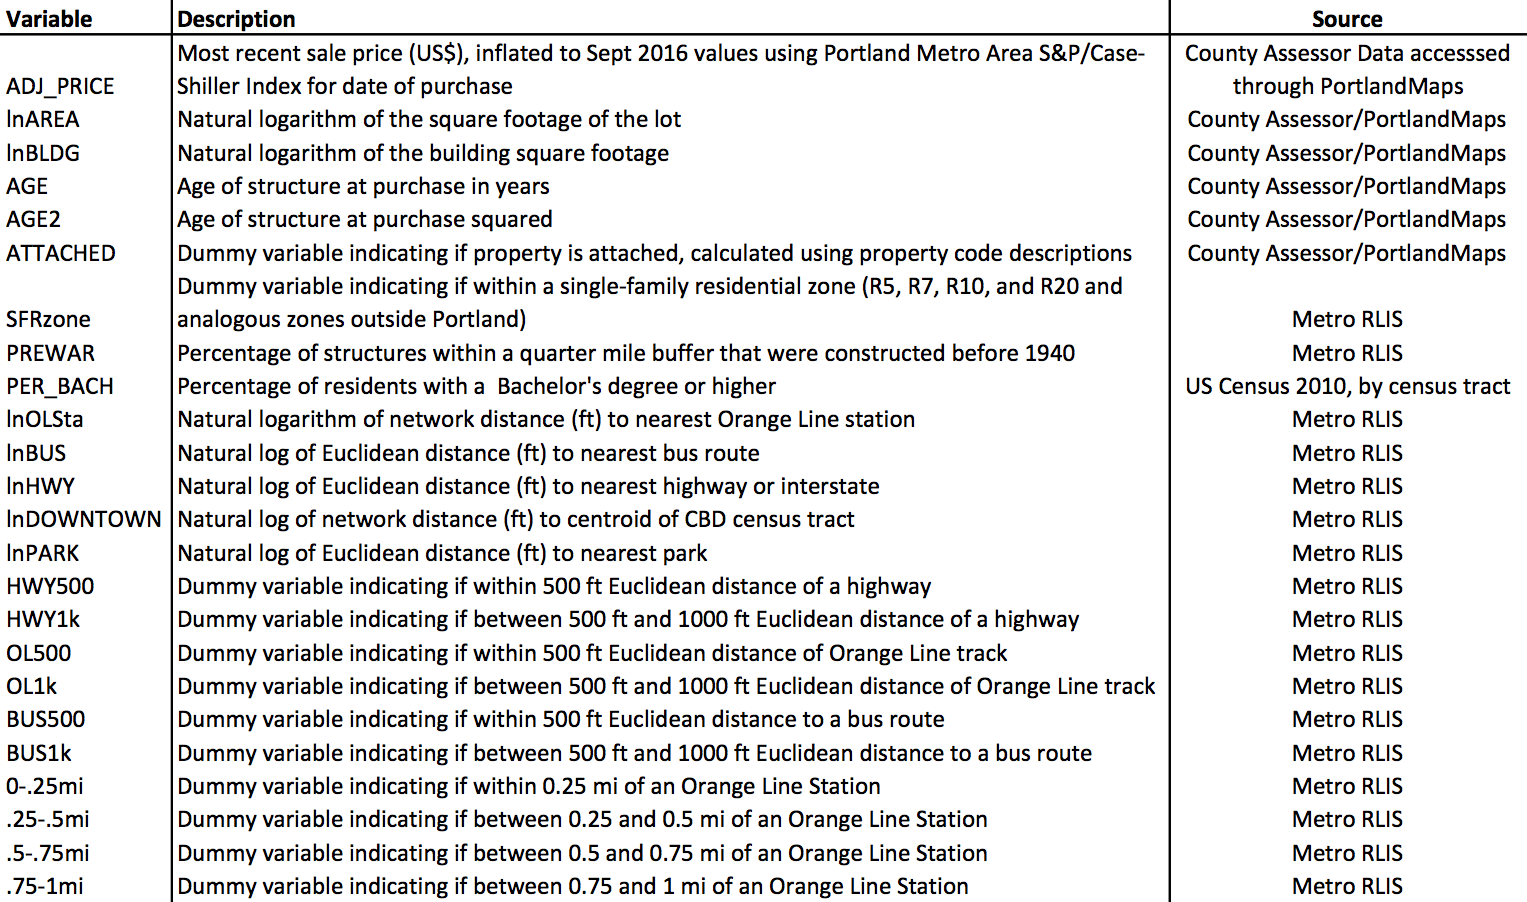
Given a dataset of 5,433 home sales, I then began an iterative process of model specifications. The general hedonic model of housing prices is that prices are a function of their structural, neighborhood, and transportation attributes, with a normally-distributed error term. The set of variables I ended up incorporating into my analysis is listed below, though numerous others were tested an discarded. There are plenty of choices to make in terms of the functional form of the model, with linear, semilog (log-transformed dependent variable), double-log, level-log, and fixed distance bands all being viable research options. For measurement of station distance, I ultimately settled on two model functional forms: a continuous level-log model and a distance bands model. Leaving the price variable untransformed was appealing for several factors. First, the resulting coefficient would relate to a predicted percentage change in price given a percentage change in distance. Thus, wealthier people buying more expensive homes would be interpreted as paying a higher rail premium in raw dollar values, which, as Duncan (2008) points out, doesn’t necessarily accord with theories of transit access valuation. Additionally, maintaining an untransformed price variable aided in interpretation of the results, particularly of dummy variables. To account for the likely nonlinear diminishment of station premiums, I log-transformed the distance variable, producing a model in which a percentage change in distance will equate to a given dollar change in price. To cross-verify results, I also measured station distance using a series of quarter mile network distance bands encoded as dummy variables. I made several other transformations of the independent variables used. I log-transformed all locational distance variables, postulating a nonlinear diminishing return to the benefits or harms of proximity. I log-transformed building square footage and lot area, due to the significant positive skew of their distribution while untransformed. I also squared age, to account for a possible U-shaped function of age and price (new homes are more expensive than 30-40 year old ones, but 100 year-old homes gain value).
Due to spatial autocorrelation of the residuals, I ended up using a series of neighborhood dummy variables based on the neighborhood association the sales occurred in, as part of a spatial fixed effects model. I refined the model used for the time series analysis by adding variables with hypothesized effects on price, including those shown in the variable list above, along with some other neighborhood socioeconomic census variables (race and median household income); land use percentage within a quarter mile buffer; distance to water, community centers, grocery stores, and commercial areas; and measures of elevation and slope. These variables were discarded for lack of significance and multicollinearity problems, judged by their performance within the hedonic model of the whole time series. The distance band dummy variables for bus and highway proximity were also comparatively insignificant and discarded for time series analysis. All time series models still showed a small, but statistically significant spatial correlation as measured by Moran’s I after imputing neighborhood fixed effects. I accounted for this spatial autocorrelation by using the spatial lag and error model in GeoDaSpace, denoted 2SLS (Two-Stage Least Squares) in the regression output table below, in addition to the simple Ordinary Least Squares model. This model incorporates two variables, W_ADJ_PRICE and lamda, that allow for the spatial interdependence of the dependent variable and error terms. All OLS results shown use robust standard errors as computed by the White test, as heteroskedasticity was significant.
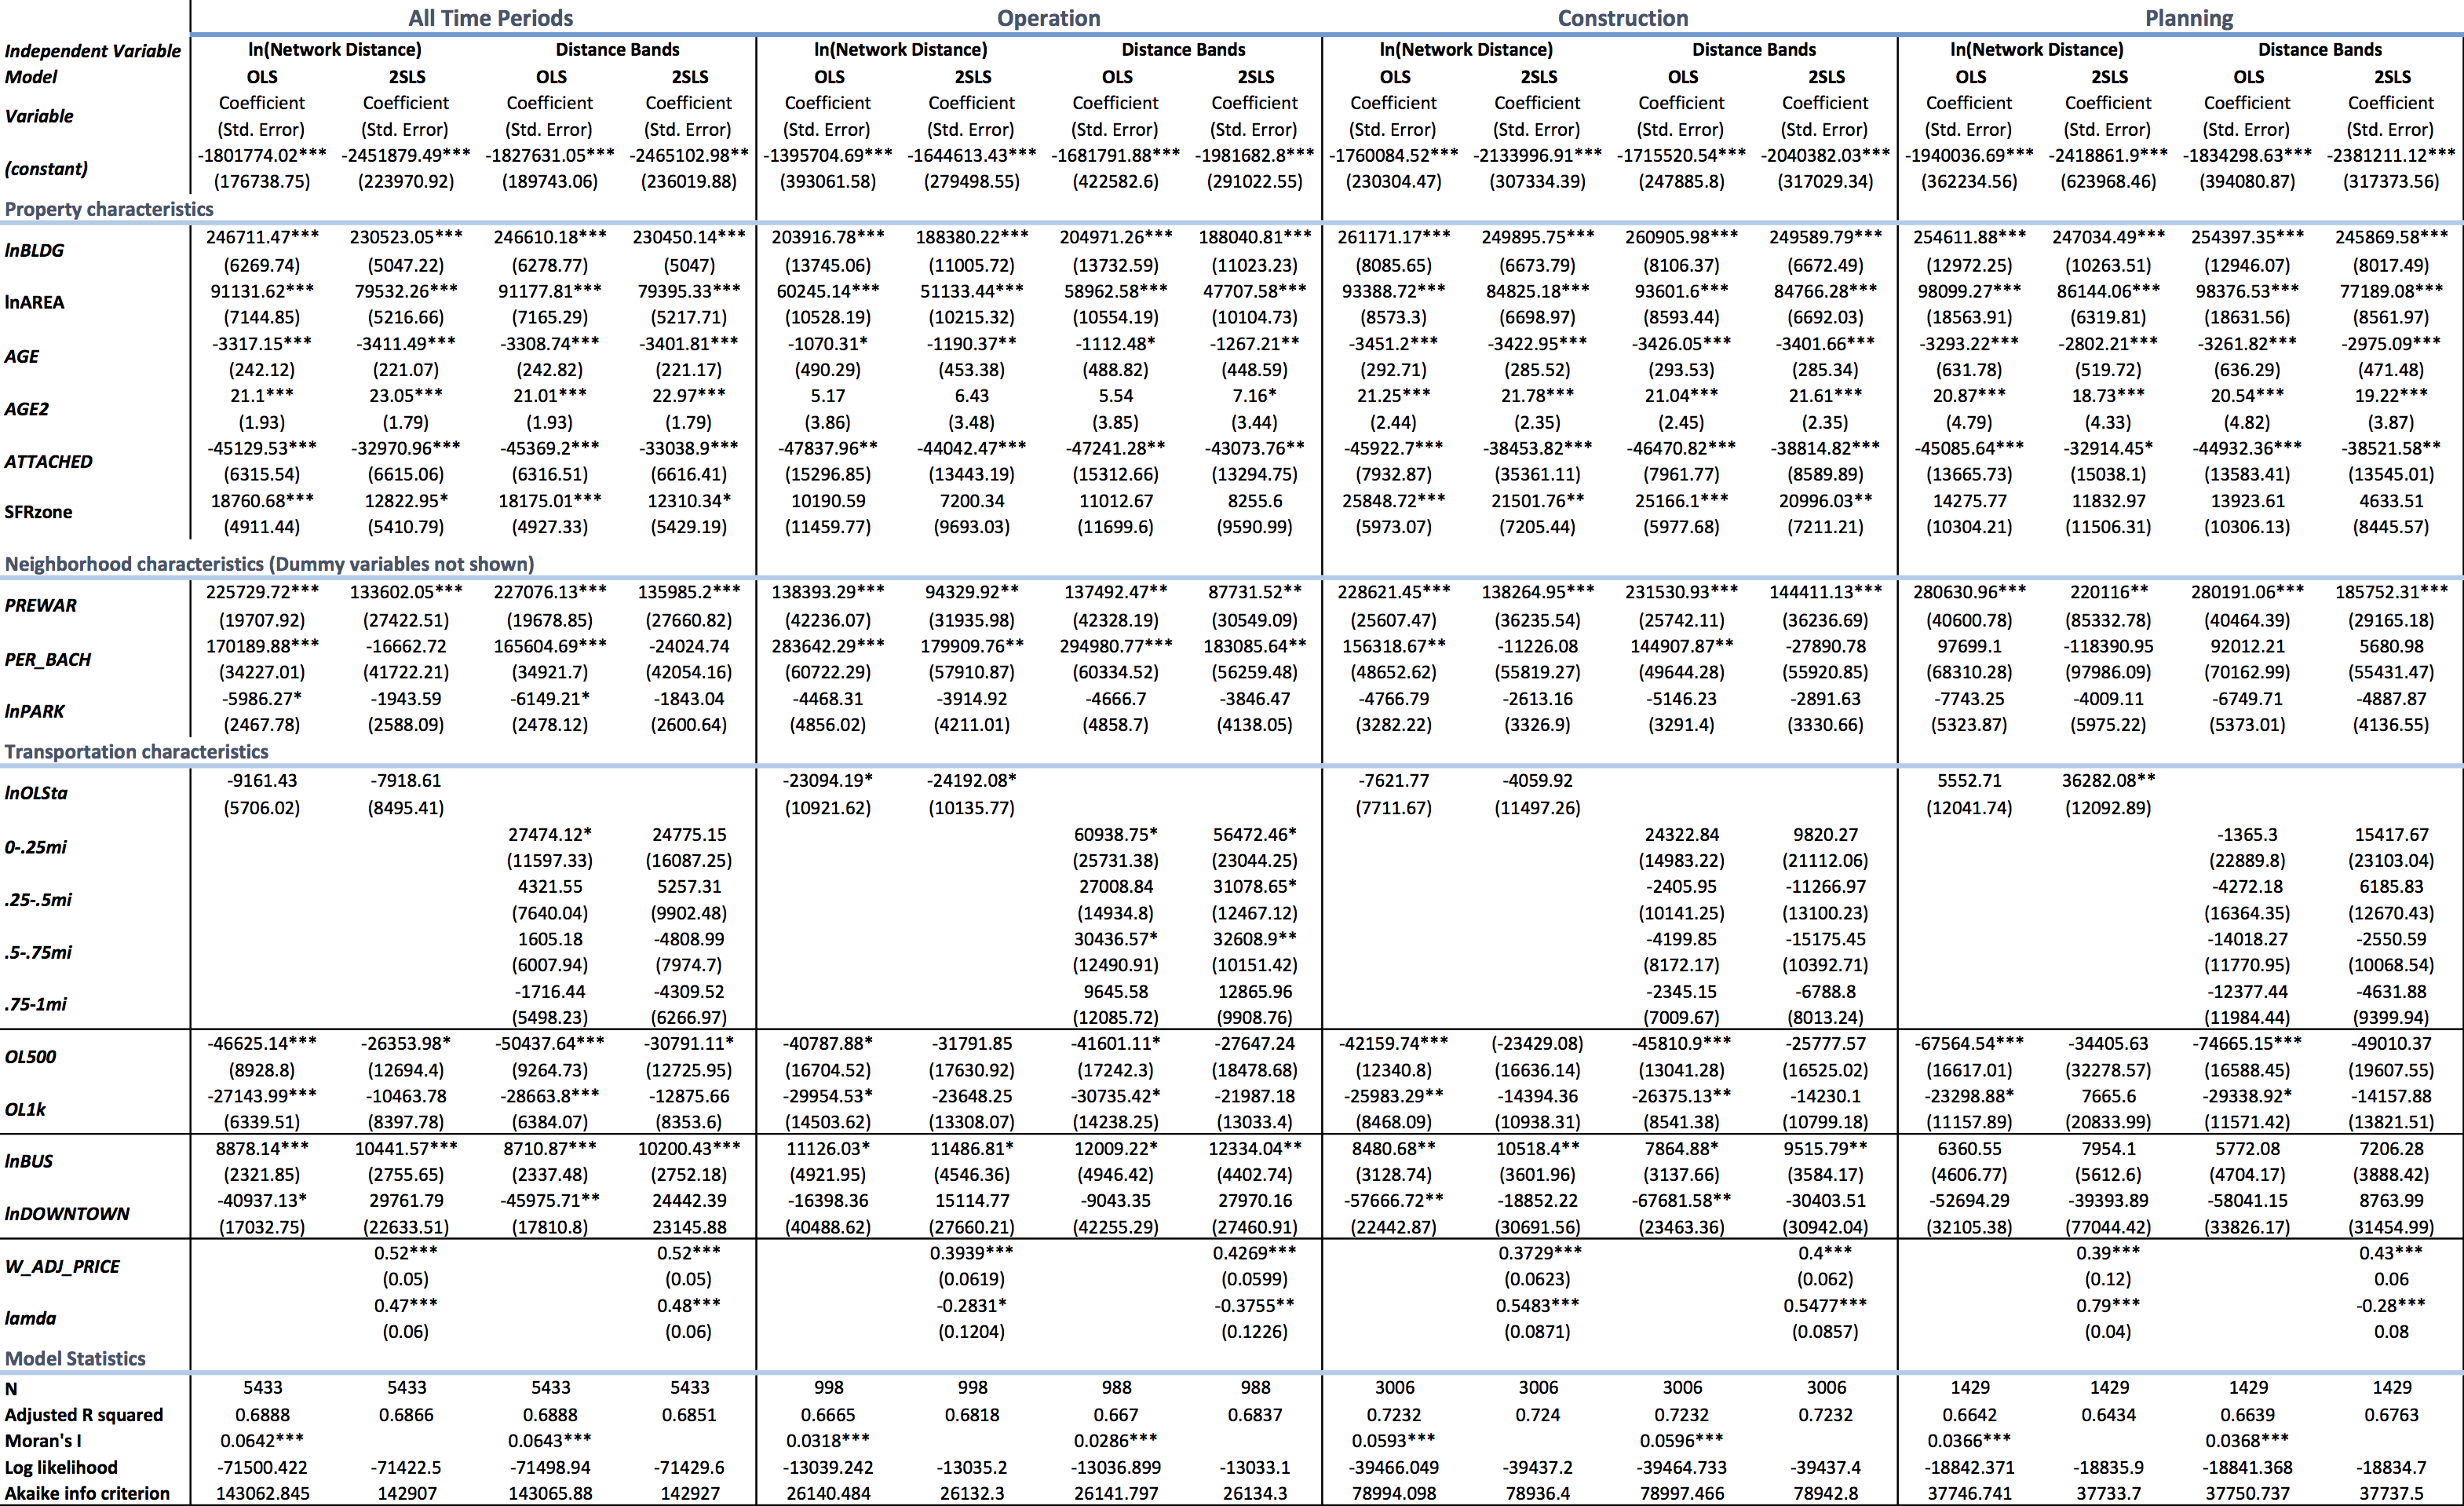
*p<.05; **p<.01; ***p<.001
The variables directly related to light rail are lnOLSta, 0-.25mi, .25-.5mi, .75-1mi, OL500, and OL1k. The coefficient for lnOLSta is the expected change in price expected from a one-log increase in network distance; lnOLSta divided by 100 is the expected change in price from a 1% change in station distance. The categorical distance variable coefficients should be interpreted as measuring the average station premium/discount of each distance band relative to properties between 1 and 1.25 miles from the station. OL500 and OL1k work similarly, except the key variable is Euclidean distance to the track itself, attempting to capture disamenity effects of the line sans accessibility or any TOD-related effects. All of the OLS models found the negative impact of immediate proximity to the line significant, with estimates ranging between a $23,000 and $75,000 discount, depending on the time period and exact distance. 2SLS models, by contrast, only find this disamenity effect weakly significant when examining all time periods as a whole. This points to the potential that the OLS-estimated disamenity effects of the line itself are an overestimation, including spatial characteristics unrelated to light rail. The fact that the OLS specification measured disamenity effects of the line before construction even started also points to such an error.
This time series regression clearly illustrates the emergence of a light rail price premium, as evidenced through the continuous and distance band specifications, with the relevant variables becoming significant after the opening of the line. Below is a plot of the bid premium resulting from the 2SLS model of continuous distance, with 95% confidence intervals marked with dotted lines. It illustrates the rapid materialization of a ~$56,000 price premium between properties 1.25 miles away and those within 0.1 miles during the operation period, with either no statistically significant effects or a significant disamenity effect in the preceding periods. The categorical dummies corroborate this finding, pointing to a $56,000 premium up to a quarter mile and a $30,000 premium between a quarter mile and three quarters of a mile.
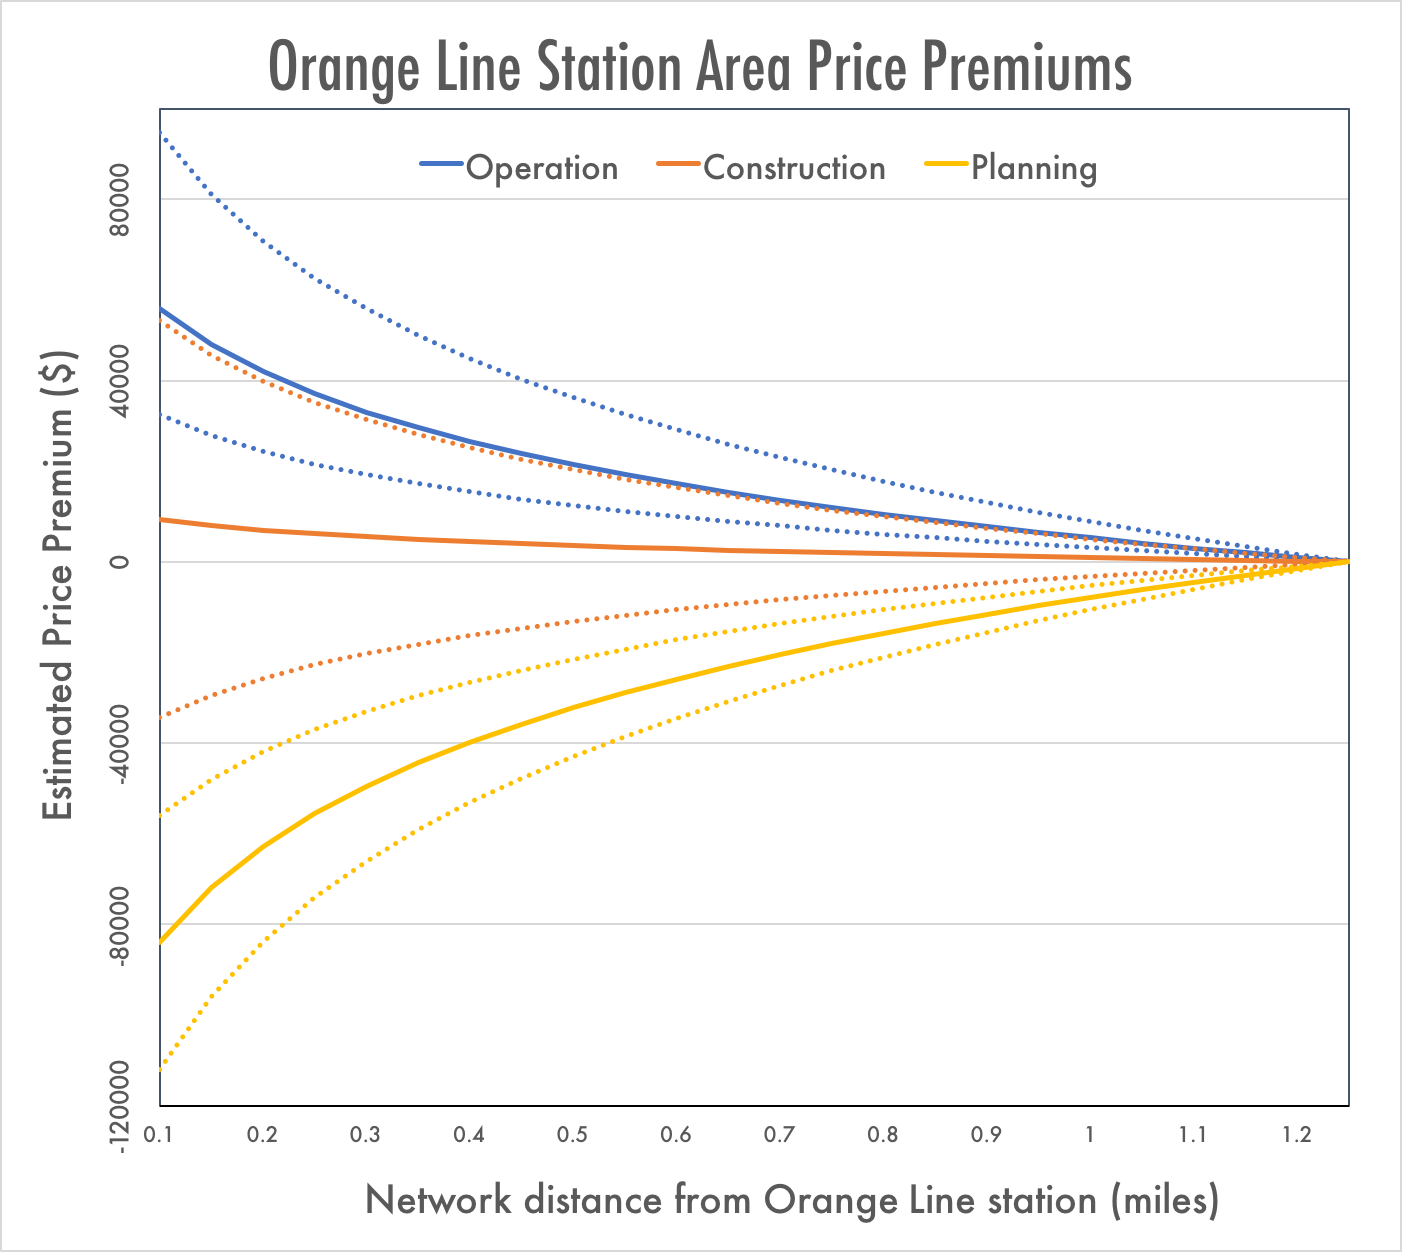
Of course, these smoothed bid-rent curves for the network as a whole elide significant distinctions. Rail networks are not spatially homogenous—both the utility of stations and the attractiveness of their environments vary widely. Hess and Almeida (2007) and Kittrell (2012) studied the price effects of light rail by individual station, finding dramatic variation in the relationship to prices along the same transit line. To investigate this potential spatial heterogeneity and help ground the econometrics in the localities of planning and equity, I conducted an individual station regression analysis. To do so, I split the sales data by the nearest station, excluding OMSI/SE Water Ave due to a lack of observations (N=9). I then ran a regression of each of these datasets, using a singular model specification developed on the dataset as a whole that eschewed the neighborhood dummy variables and distance band specifications used in the time series analysis. For station areas revealing significant spatial autocorrelation, as measured through the significance of Moran’s I, I ran the spatial lag and error model.
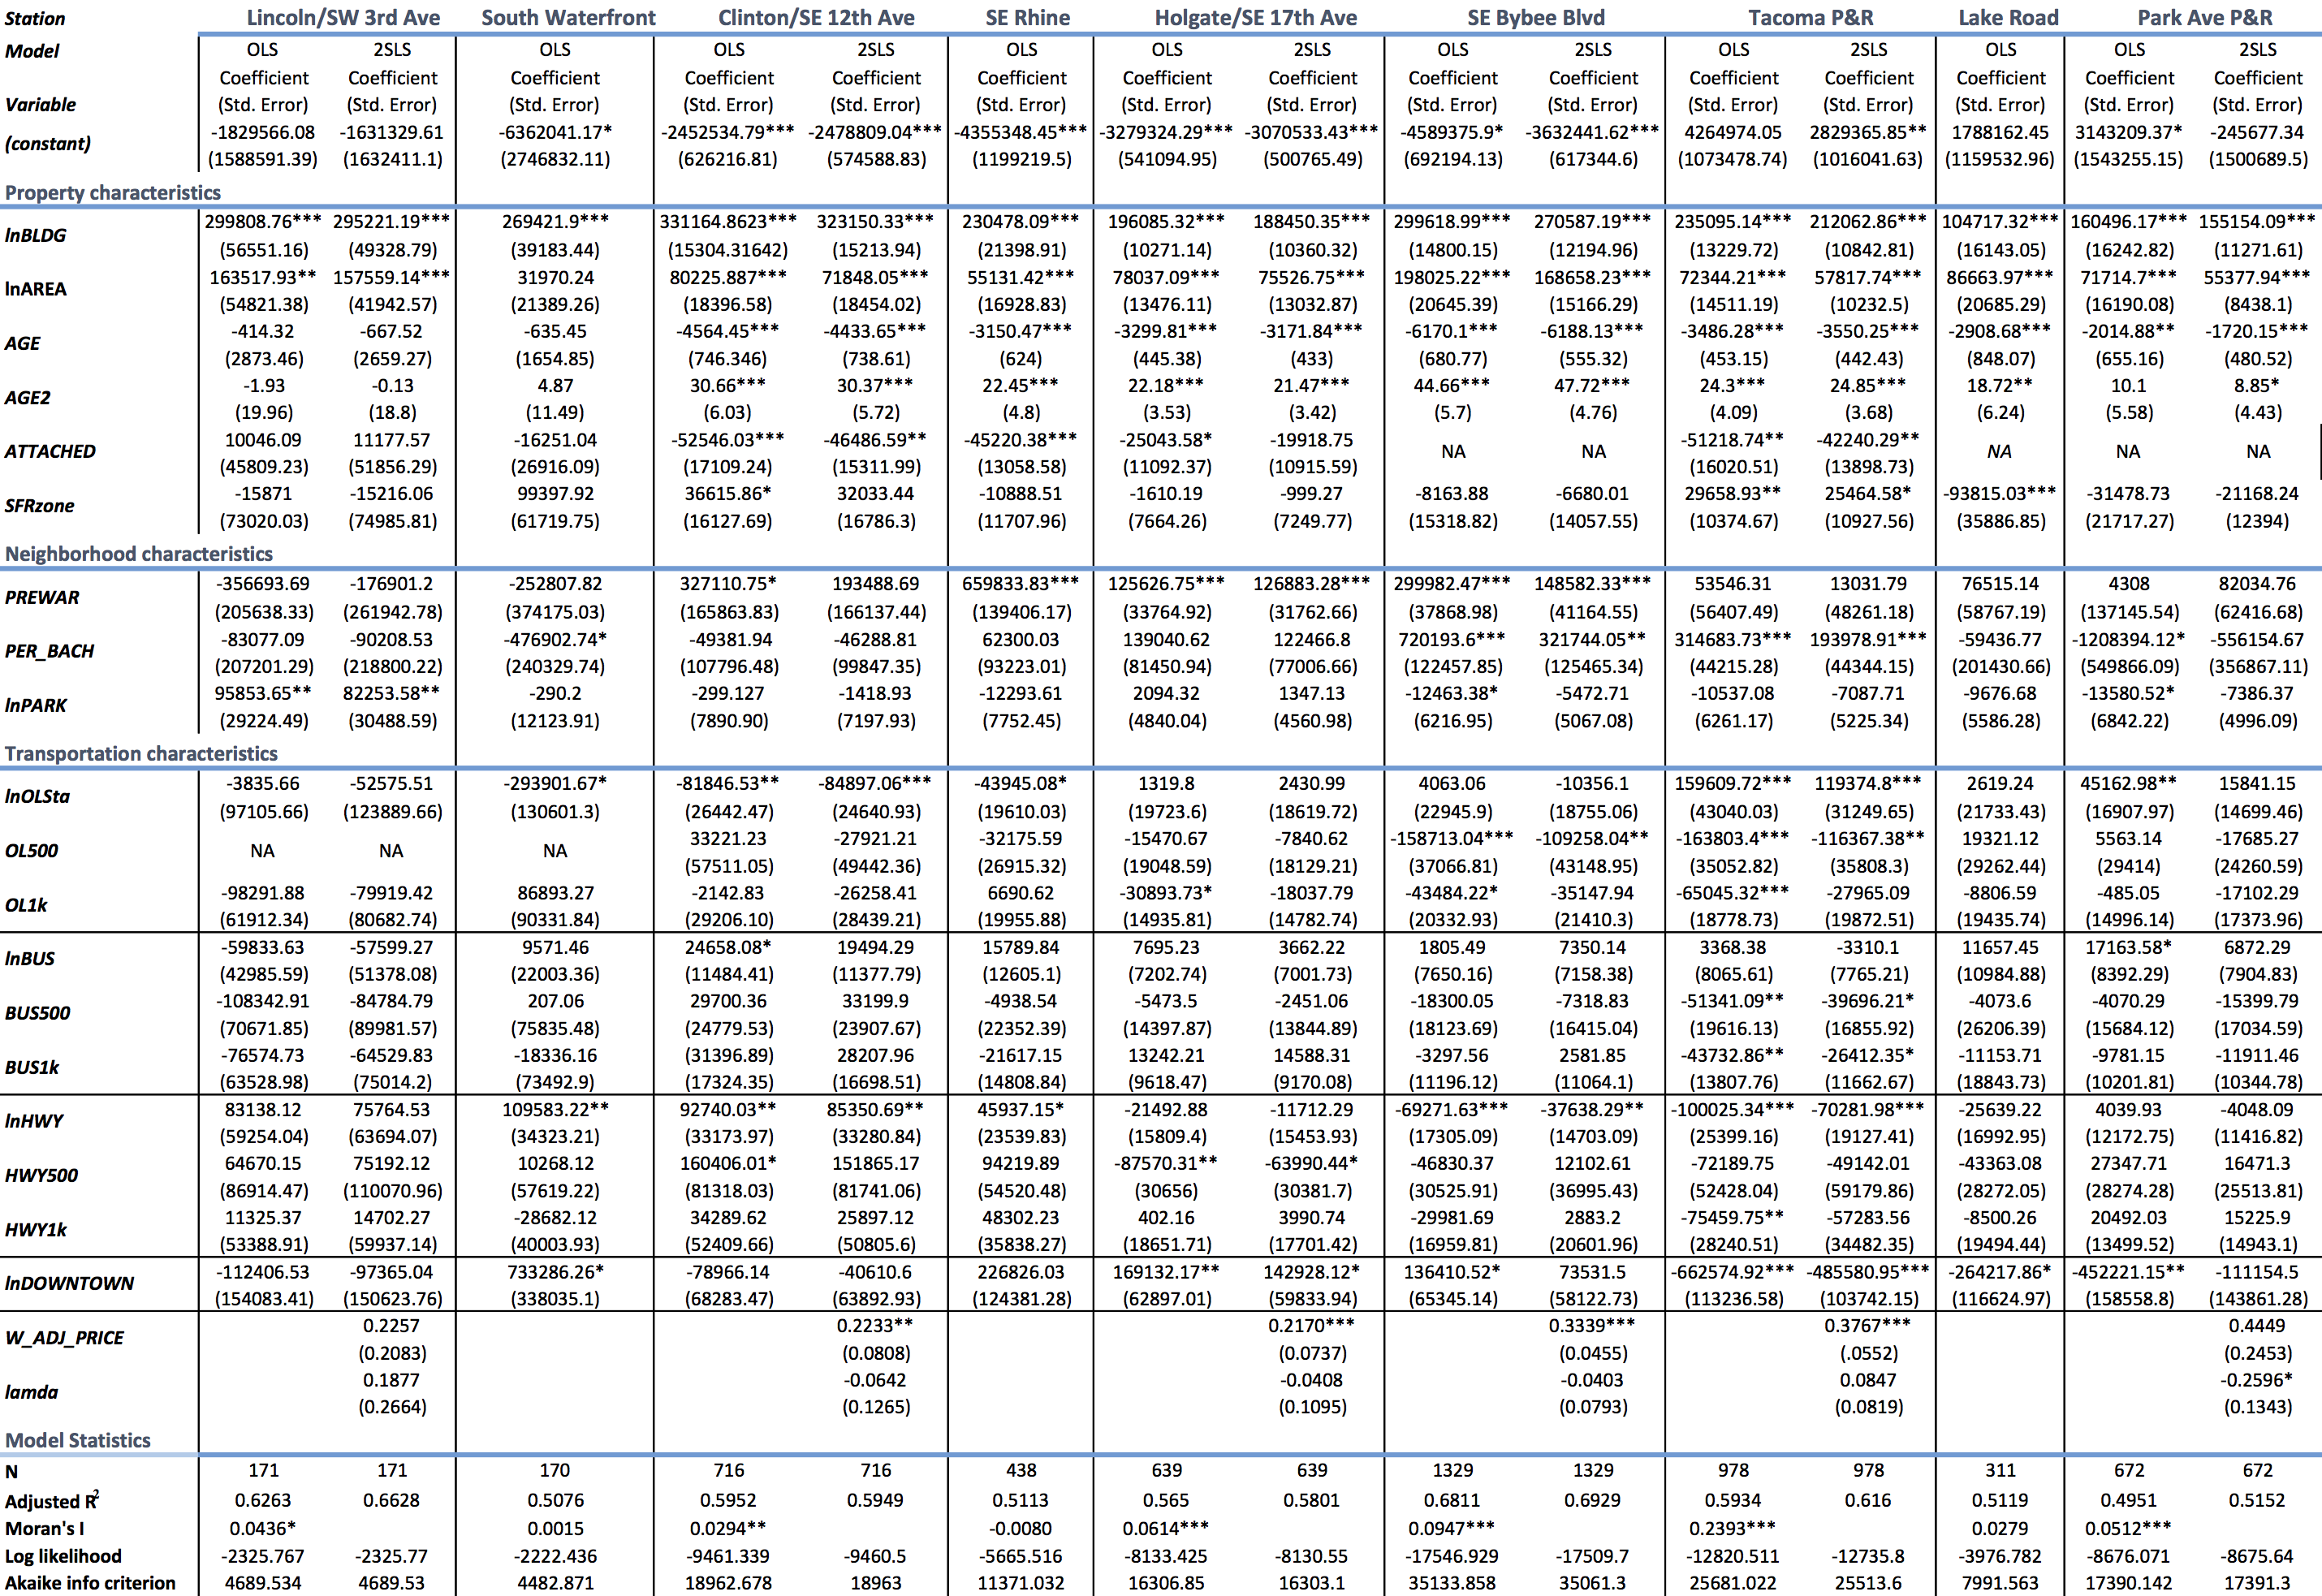
*p<.05; **p<.01; ***p<.001
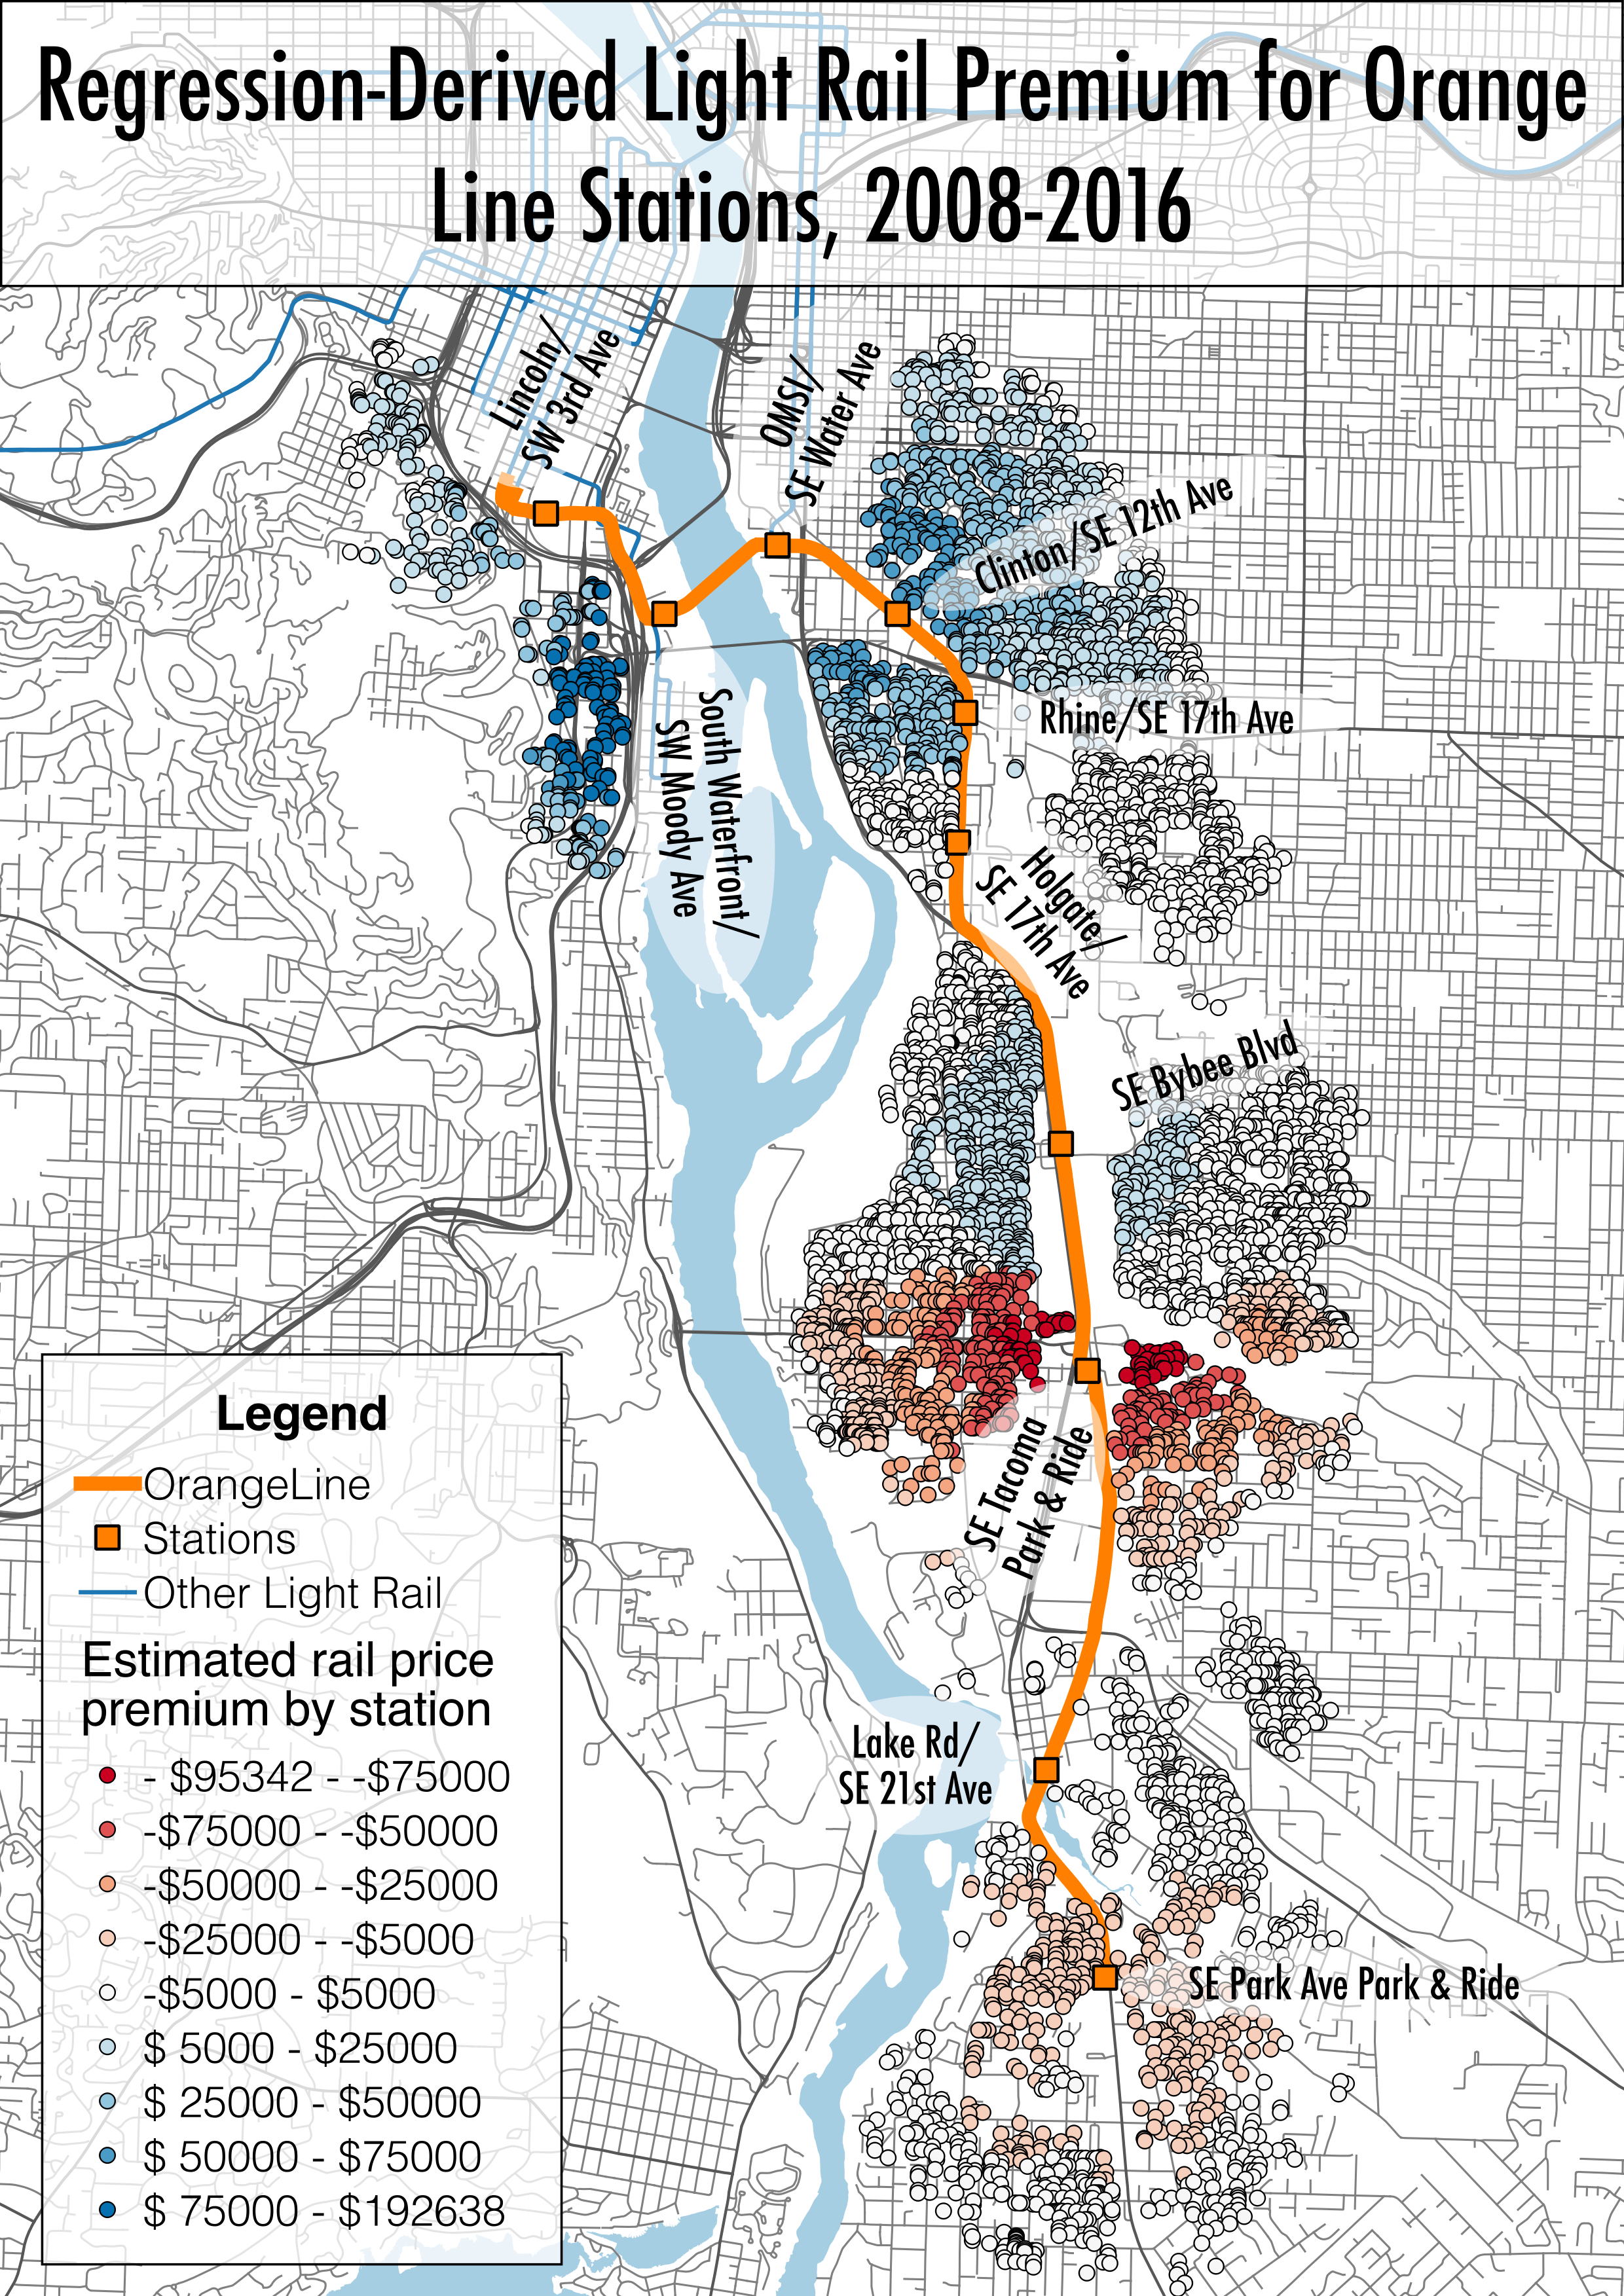
Estimation of the station-specific price premiums was hampered in large part by the limited sample size available. Given that the time series analysis indicated that Orange Line station locations have only recently been capitalized into land markets, it is perhaps unsurprising that a majority of the results were statistically insignificant. Restricting the analysis to sales within the operation period was not a viable option, as it would reduce the observations for many stations below 100. Despite this limitation, statistically significant effects were found for four stations by both models: a transit-premium for the South Waterfront ($2,500 increase with a 1% decrease in distance), Clinton/SE 12th Ave ($810-$840 per 1% decrease in distance), and Rhine/SE 17th Ave stations ($440 increase per 1% decrease in distance) and a disamenity effect for the SE Tacoma Park & Ride ($1,200-$,1600 decrease per 1% decrease in distance). OLS estimates also found a negative relationship between proximity to the Park Ave Park & Ride and home prices ($450 decrease per 1% decrease in distance), though the 2SLS estimate was not significant. To visualize these spatial patterns, I mapped the derived light rail premium for each sale. This was done by multiplying the 2SLS estimates of station-specific coefficients by the percentage change in the distance to the nearest station from the corridor boundary (1.25 mi) to that of the observed sale. The results indicate a strong light rail premium near the city center and a discount for properties near a park and ride (though this provides no analysis provides no indication as whether such a discount applied to proximity to this highway interchange pre-light rail). As this analysis uses residential sales, it is admittedly poorly suited to analyzing the effects of two key stations: OMSI and the downtown Milwaukie (Lake Road).
Implications
The price effects found by this analysis suggest that the Orange Line has fed rapid price appreciation within the corridor upon operation, provide evidence that access to light rail has been capitalized in the housing market. On one level, this may be construed as an indicator of the line’s success—an indication that market actors collectively value this capital expenditure. Such a relationship raises some serious equity issues, however; increased home prices will tend to displace the lower income, transit-dependent residents who most benefit from increased transit access, at least in the absence of significant ameliorative public policy. The Orange Line was envisioned as the catalyst for the creation of desirable places, but the implications of desirability within a market economy were left uncontemplated during the planning process. Instead, TriMet and the Cities of Portland and Milwaukie were chiefly concerned with making sure that light rail “paid off” in terms of generating real estate investment, creating station area assessments of development possibilities and the capital expenditures which would be most likely to overcome limitations to development. Treating development itself as a policy benefit raises some very problematic tendencies; the feasibility of development is driven fundamentally by the rents one is able to attain, making these price effects a possible unstated benefit of light rail, in the eyes of agencies geared towards increasing transit-oriented development.
This brings us to a broader point about the dilemma faced by cities working under a neoliberal regime. Investments in amenities that are valued by people are valued by the market, generating a contradiction between aims to enhance the attractiveness/accessibility of areas and the maintenance of affordability. Solving the inequities resulting from the very functioning of the political-economic system is undoubtedly beyond the reach of an individual municipality; even amelioration of the inequalities of housing access in relation to public transit (e.g. through inclusive zoning or public housing near transit) is admittedly constrained by the market orientation and constraints of municipalities. Nevertheless, this does not absolve cities of responsibility for the spillover price effects of their ; the spillover price effects of light rail need to be incorporated into the planning process explicitly, alongside a mechanism to capture these price increases to fund affordable housing provision.
Leave a Reply