Reexamining the Effects of the UGB on the Housing Market
A cursory examination of land value by square foot reveals a significant relationship between the Urban Growth Boundary and land values, with values instantly plunging from approximately $5 to $10 per square foot to less than $1. This holds true around most of the boundary, with the exception of the around Forest Park in northwest Portland (protected parkland usually has a relatively low land value per square foot) and in Damascus in the southeastern corner of the boundary. Interestingly, despite being brought inside the UGB recently, Damascus remains zoned rural and still reflects the land values seen outside the boundary. Additionally, there are several small towns outside the boundary which are zoned for urban usage, visible as small spikes in land value.
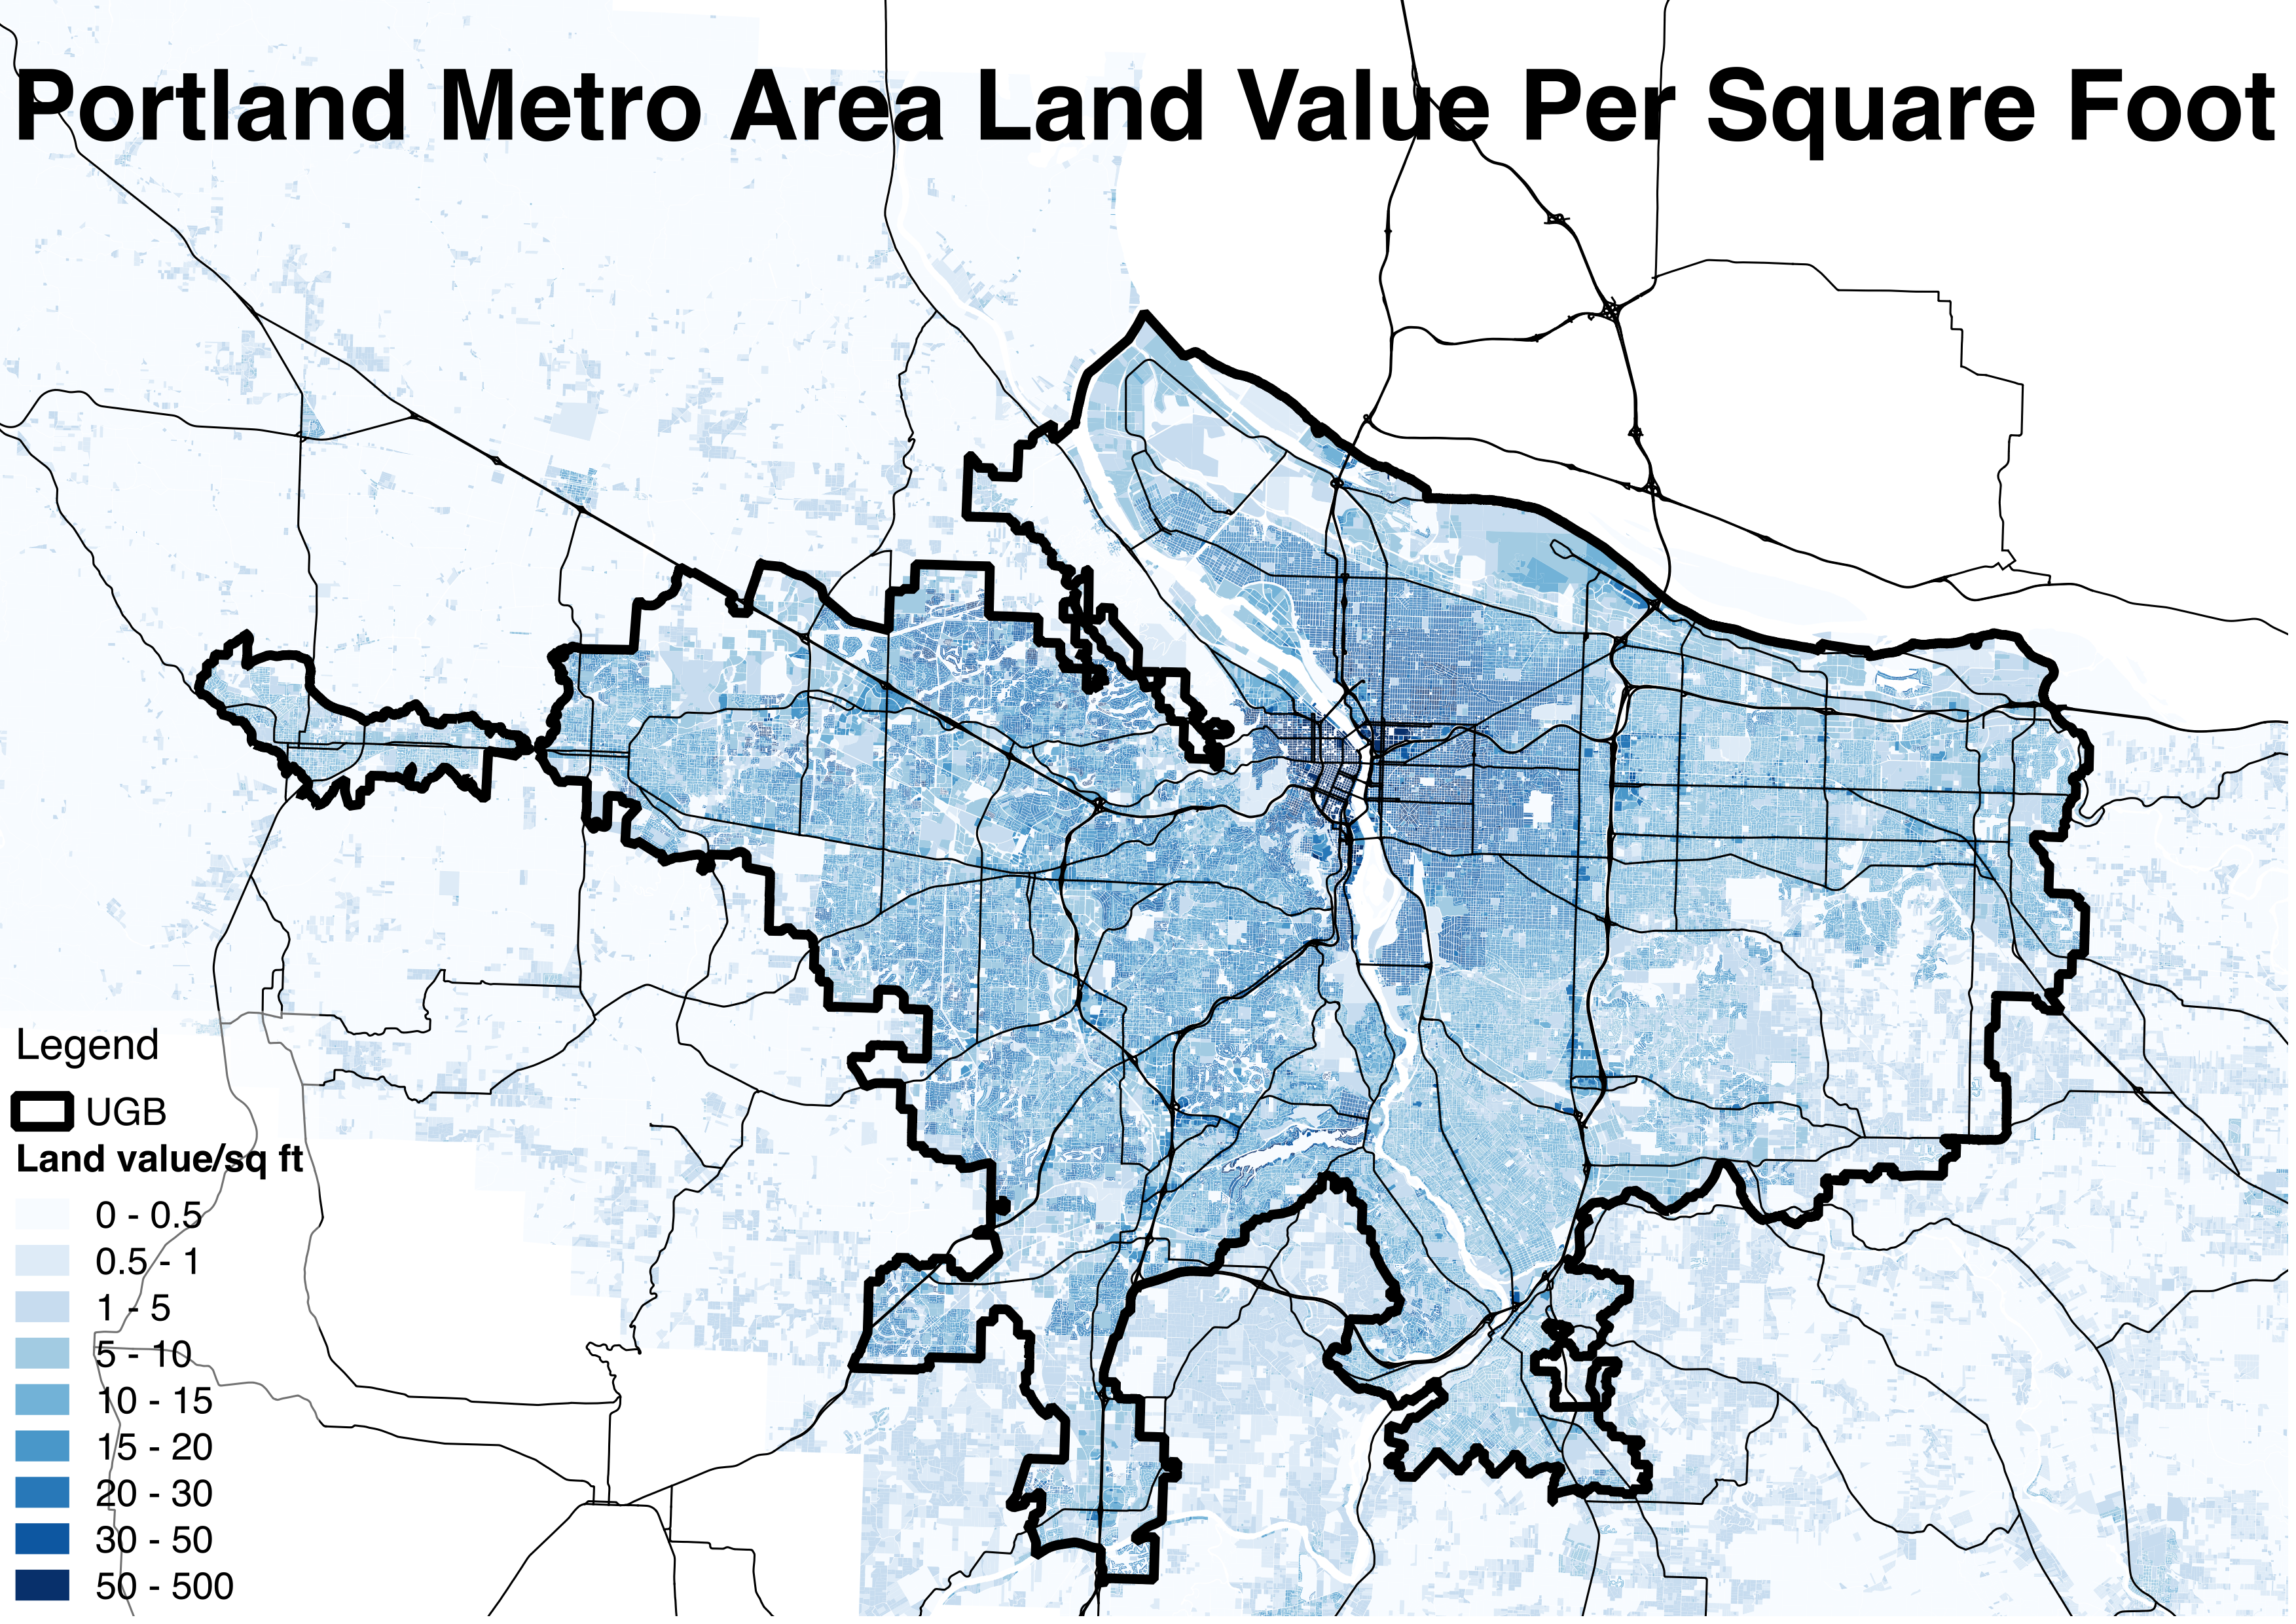
Figure 1.1. Land value & the UGB
After accounting for the influence of zoning on land values, a very different picture emerges. The median land value for single family residential zones inside and outside the boundary is substantially undifferentiated after controlling for the distance from the zones to the city center. The lines of best fit (see figure 1.2) for single family zones as categorized by whether they are inside or outside the boundary are essentially identical, with y-intercepts of 23.089 and 22.478 and slopes of -0.6047 and -0.5905 respectively. These results provide an indication that residential land inside and outside the boundary displays no marked split and acts as a single land market. This parallels previous empirical studies (Downs 1997; Jun 2006) finding little effect of the UGB on housing values. The extent to which the UGB maps onto land values is reflective only to the degree that the UGB reflects and solidifies urban and non-urban zoning designations.
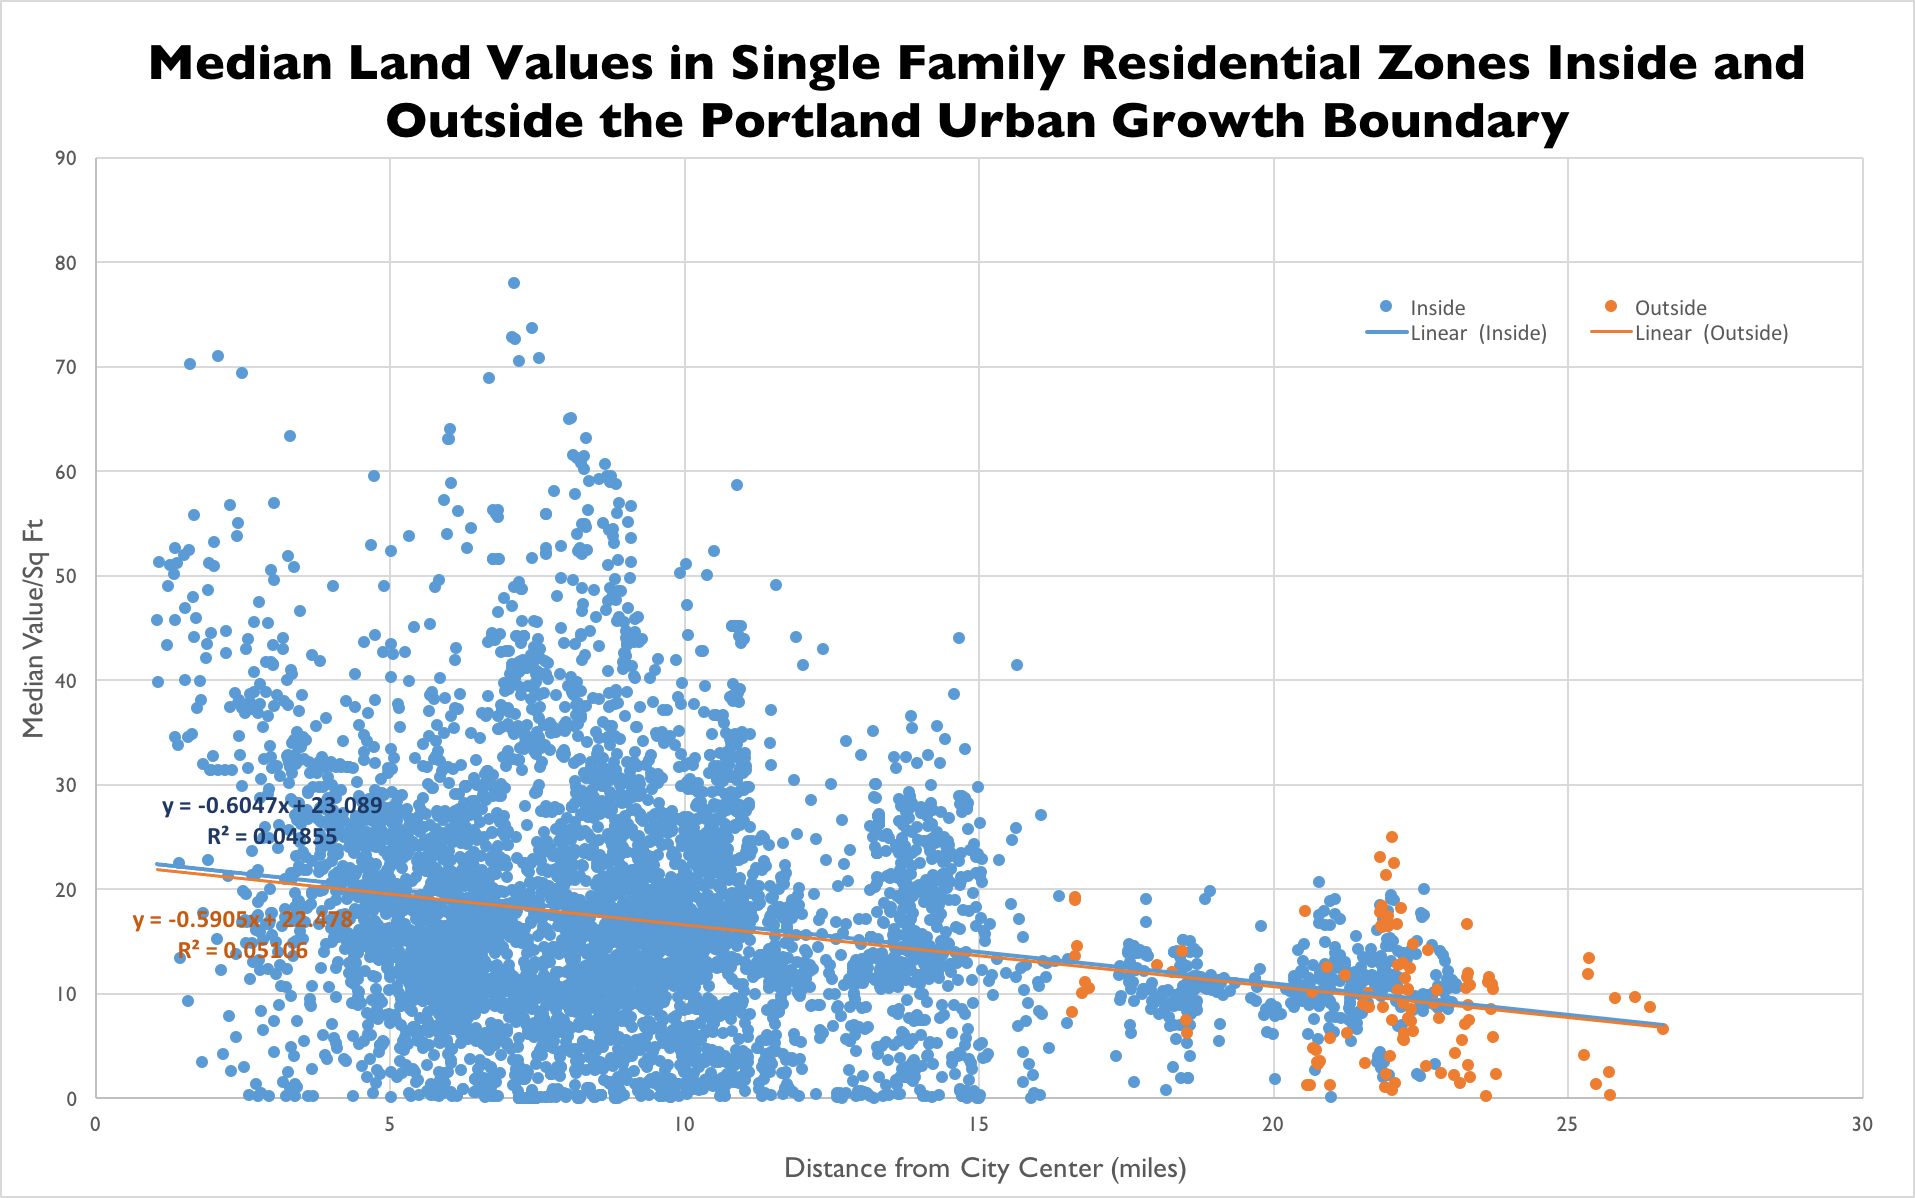
Figure 1.2. Land values for single-family residential zones inside and outside the UGB
Racial restructuring in Portland
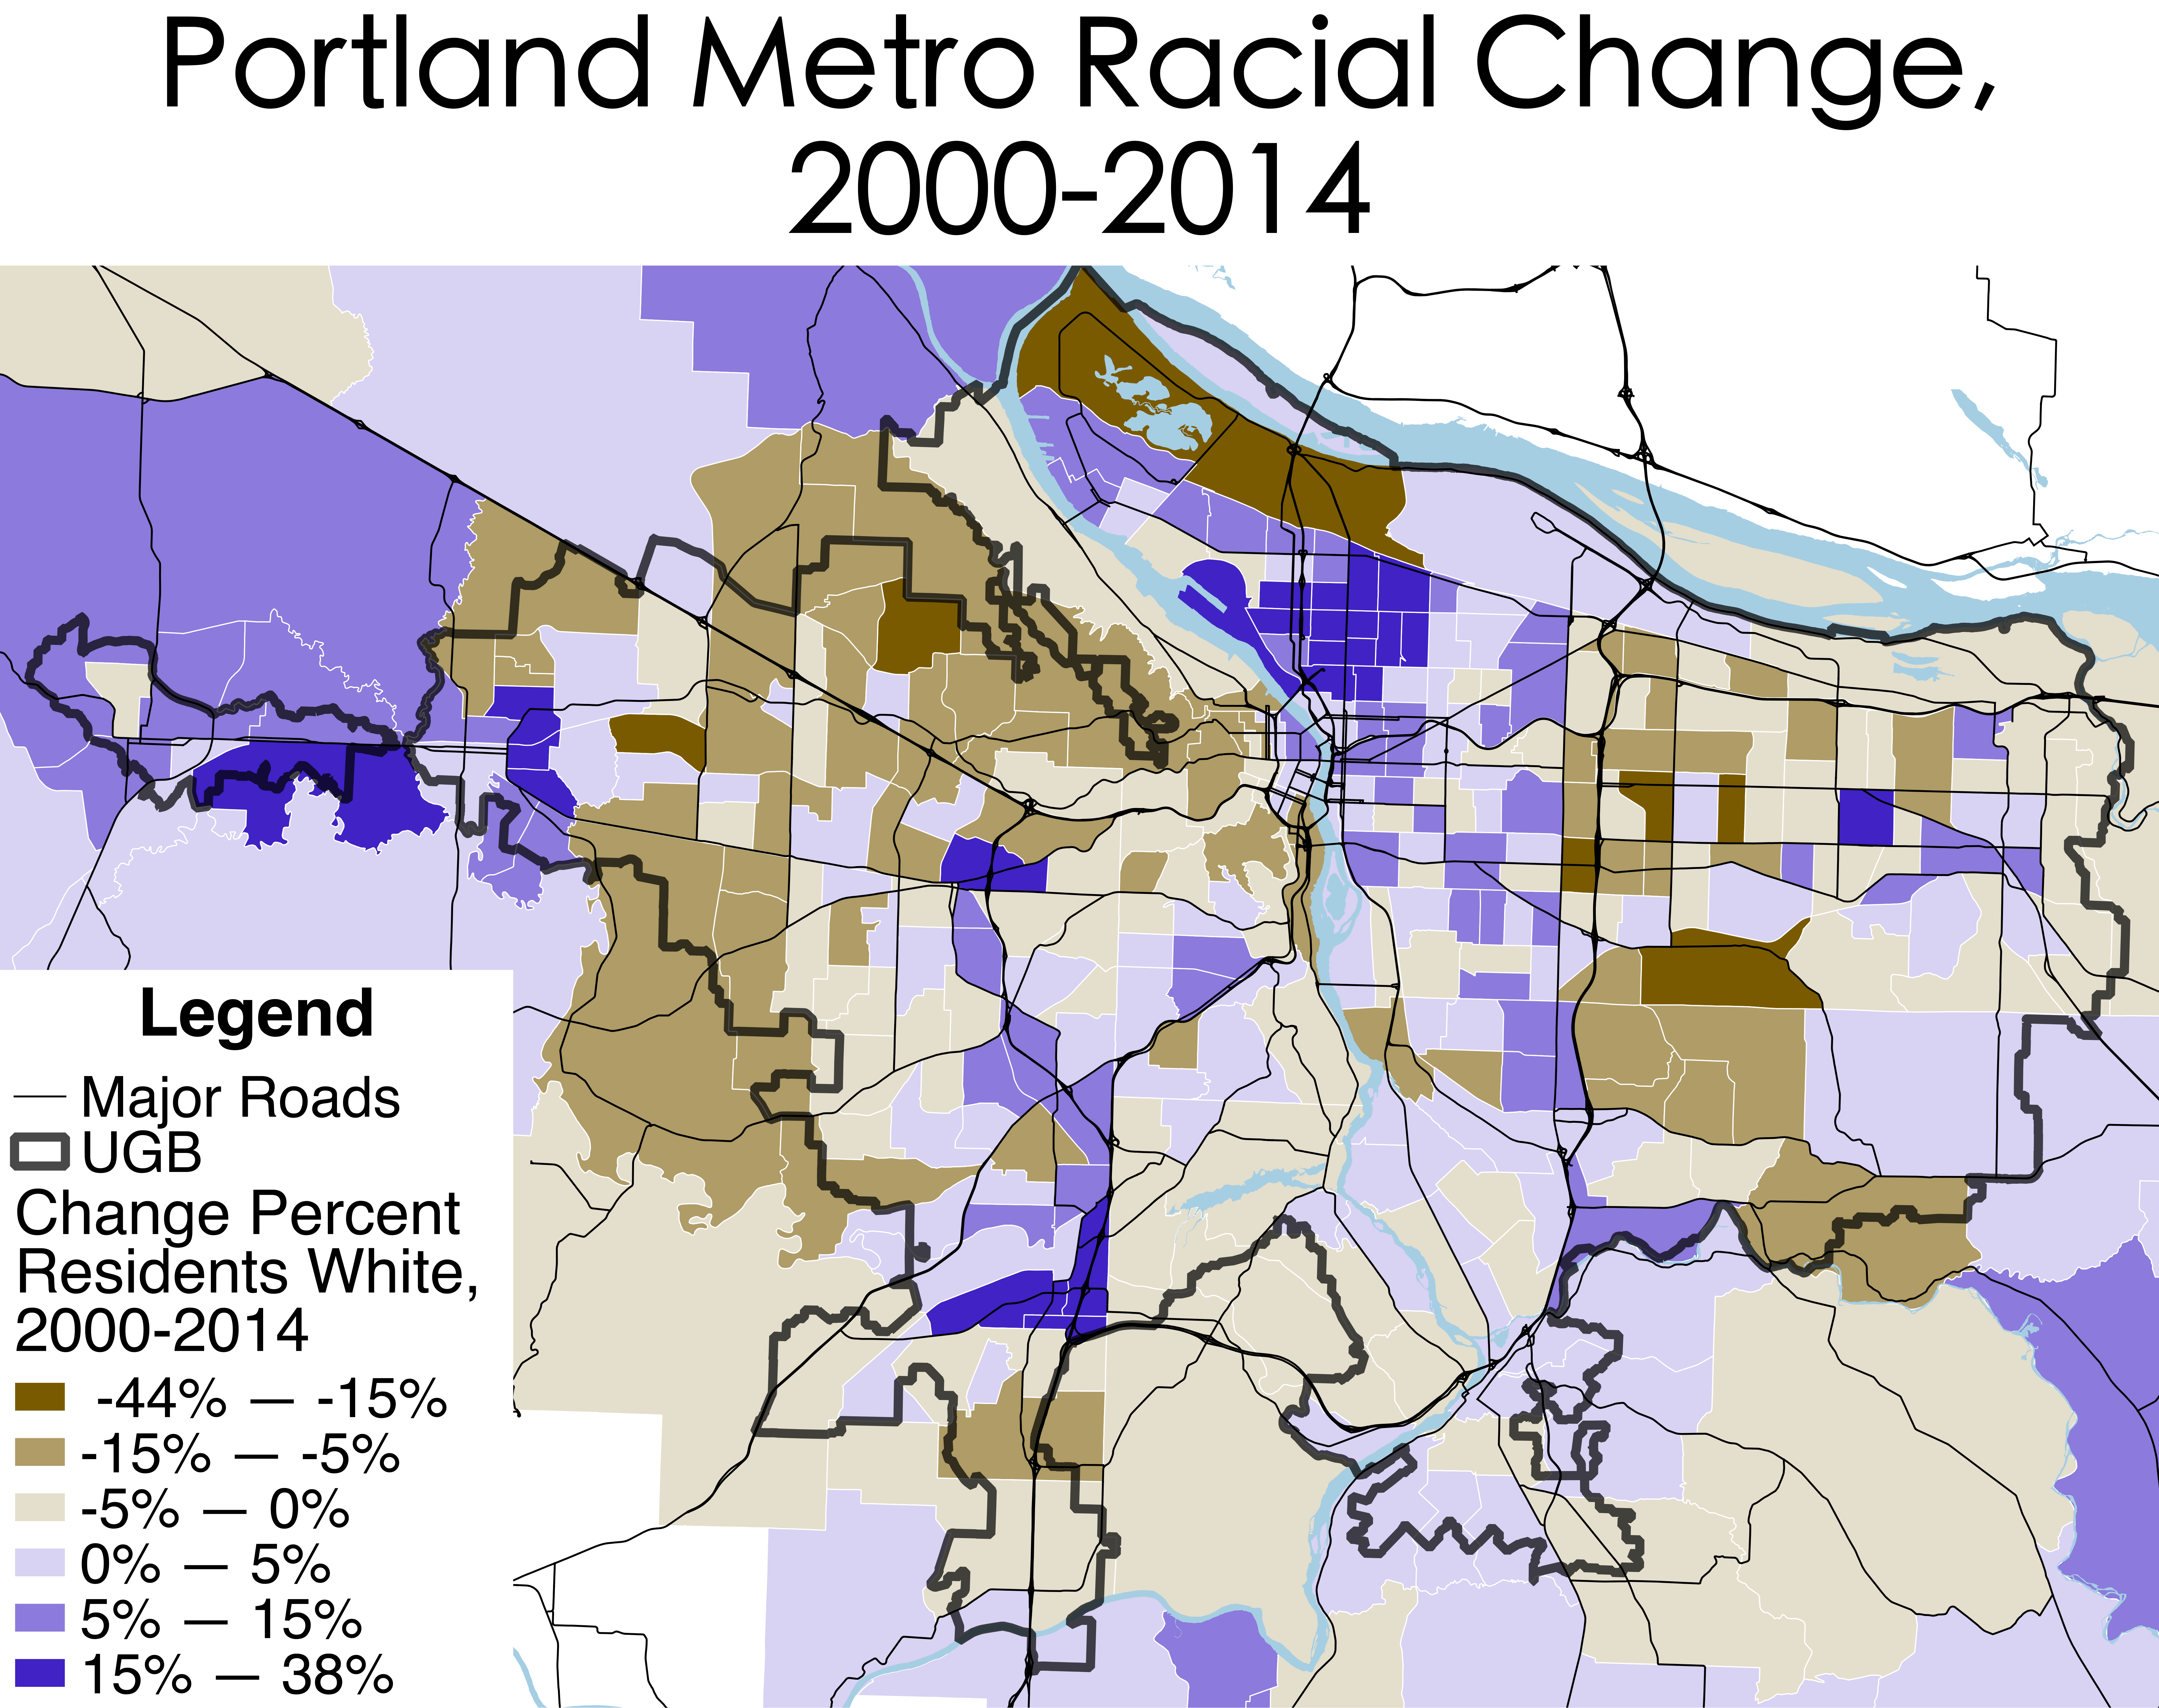
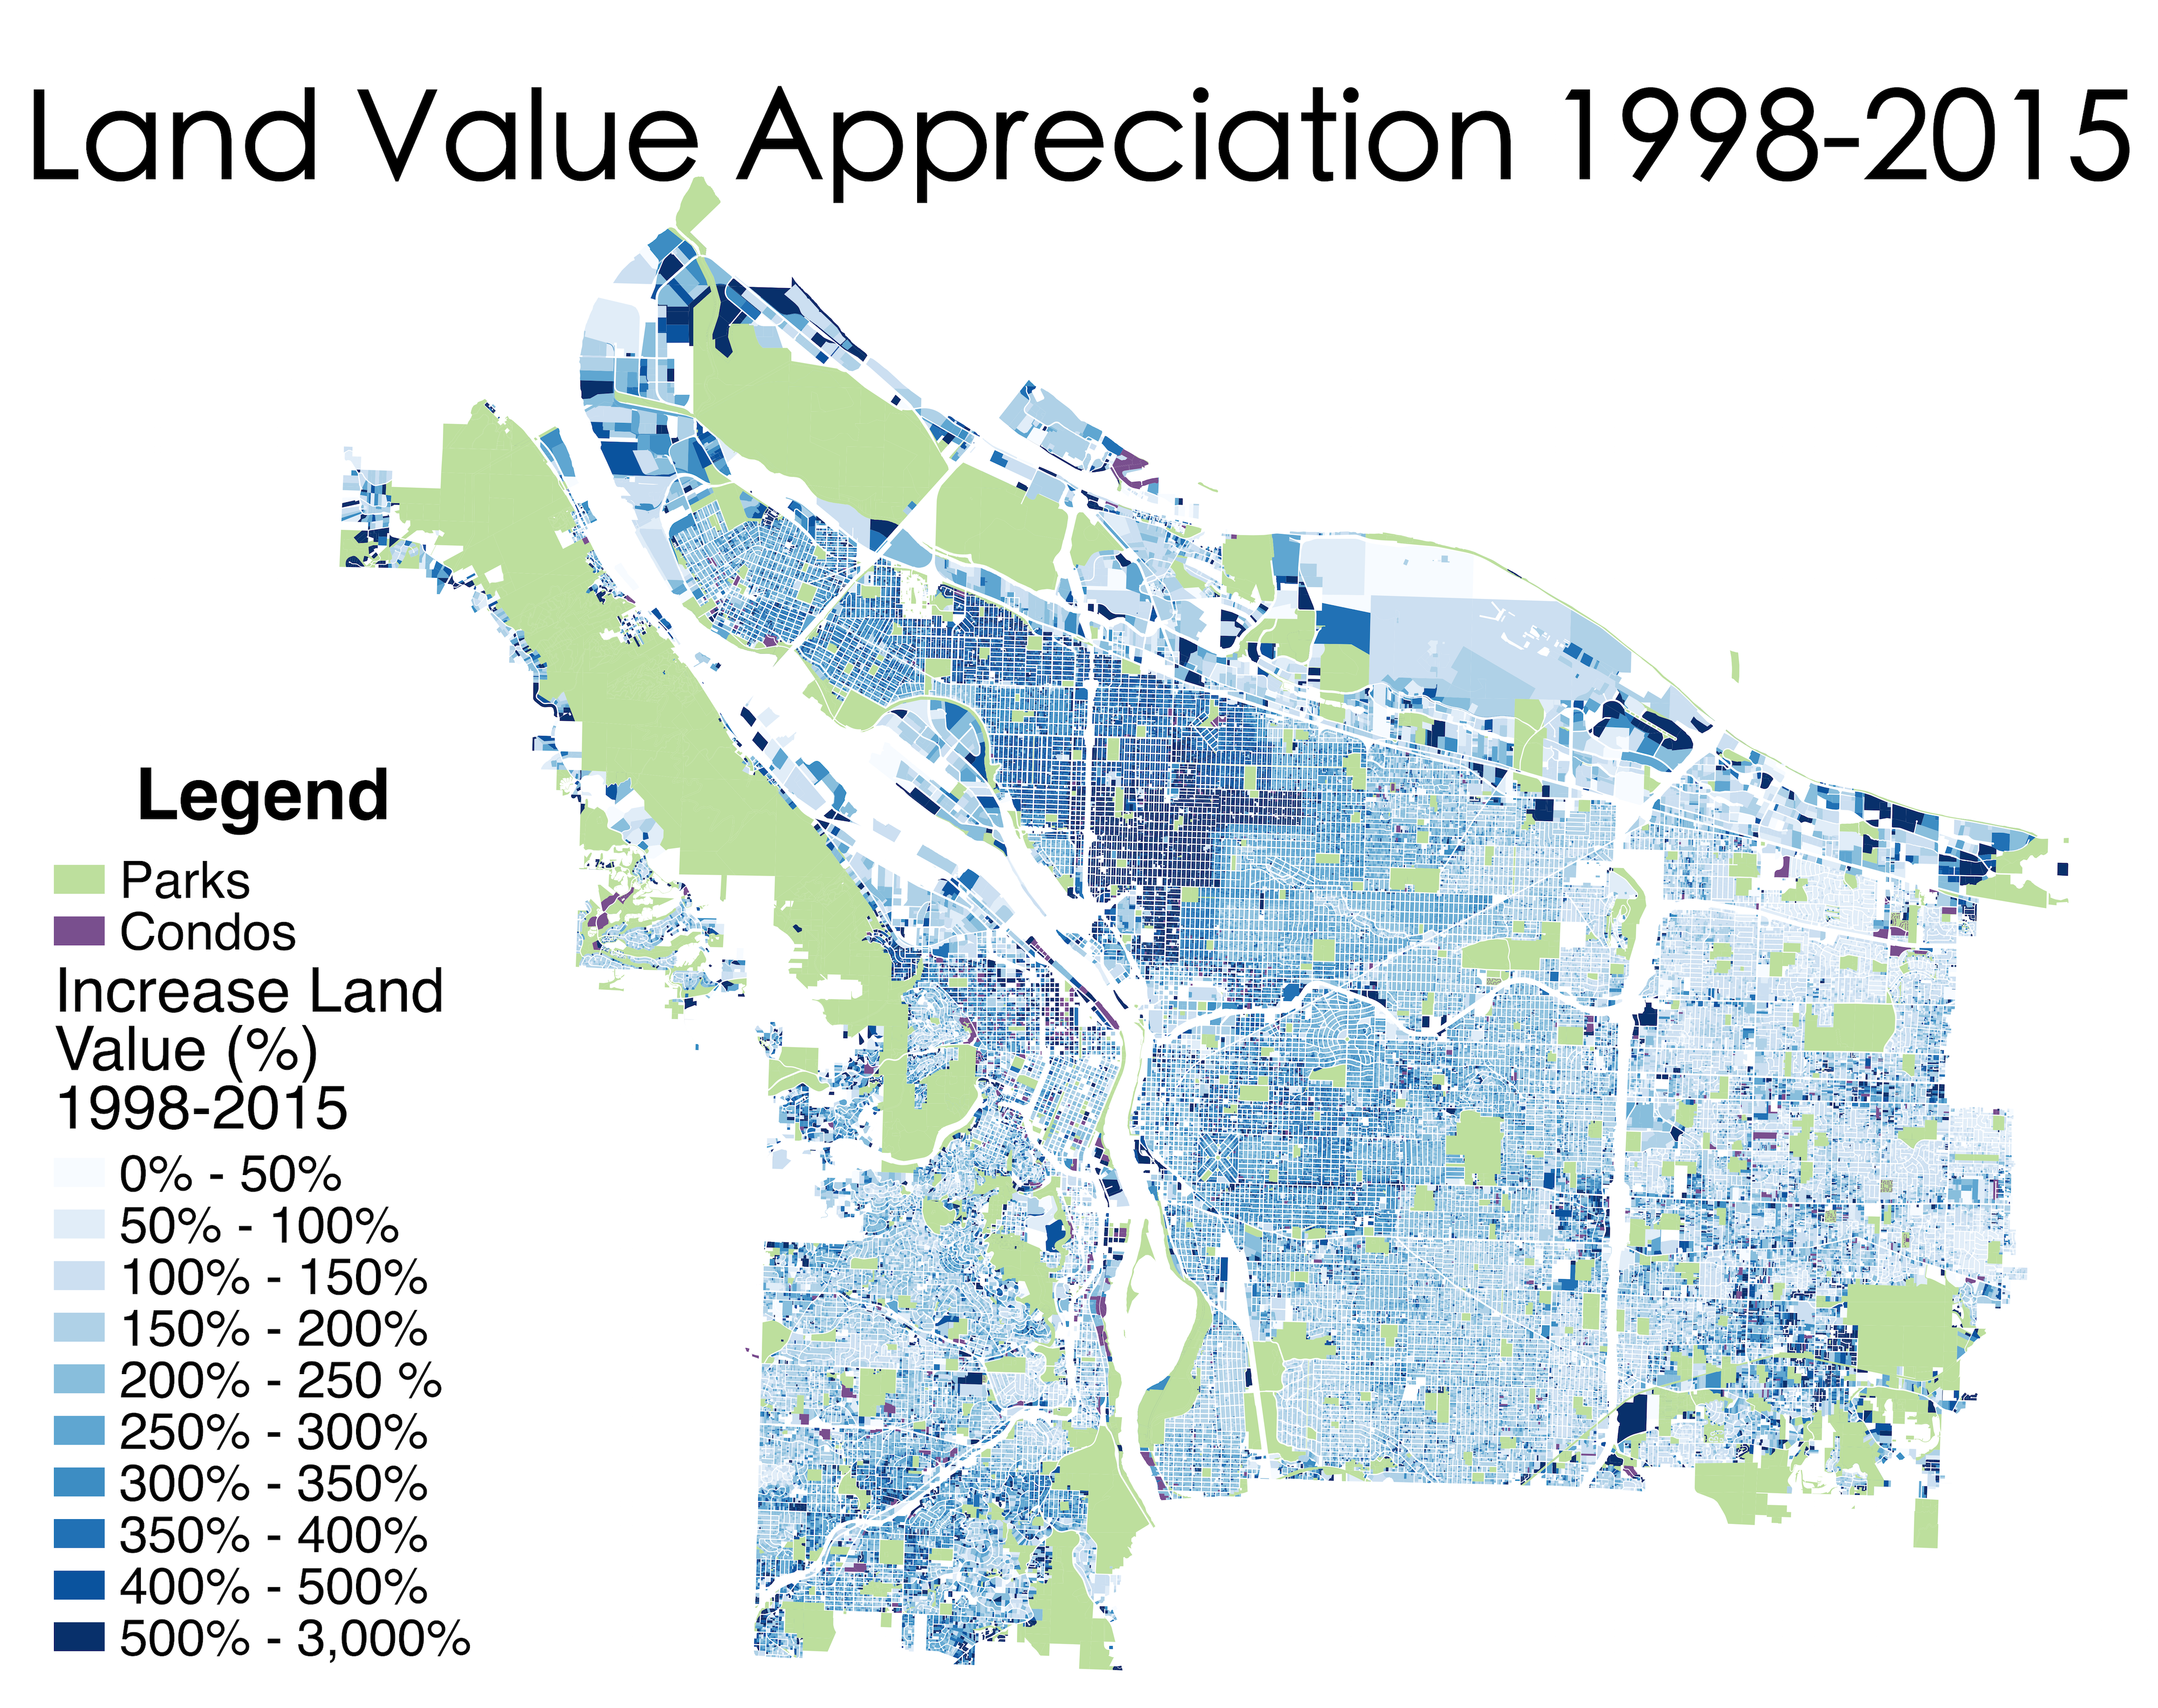
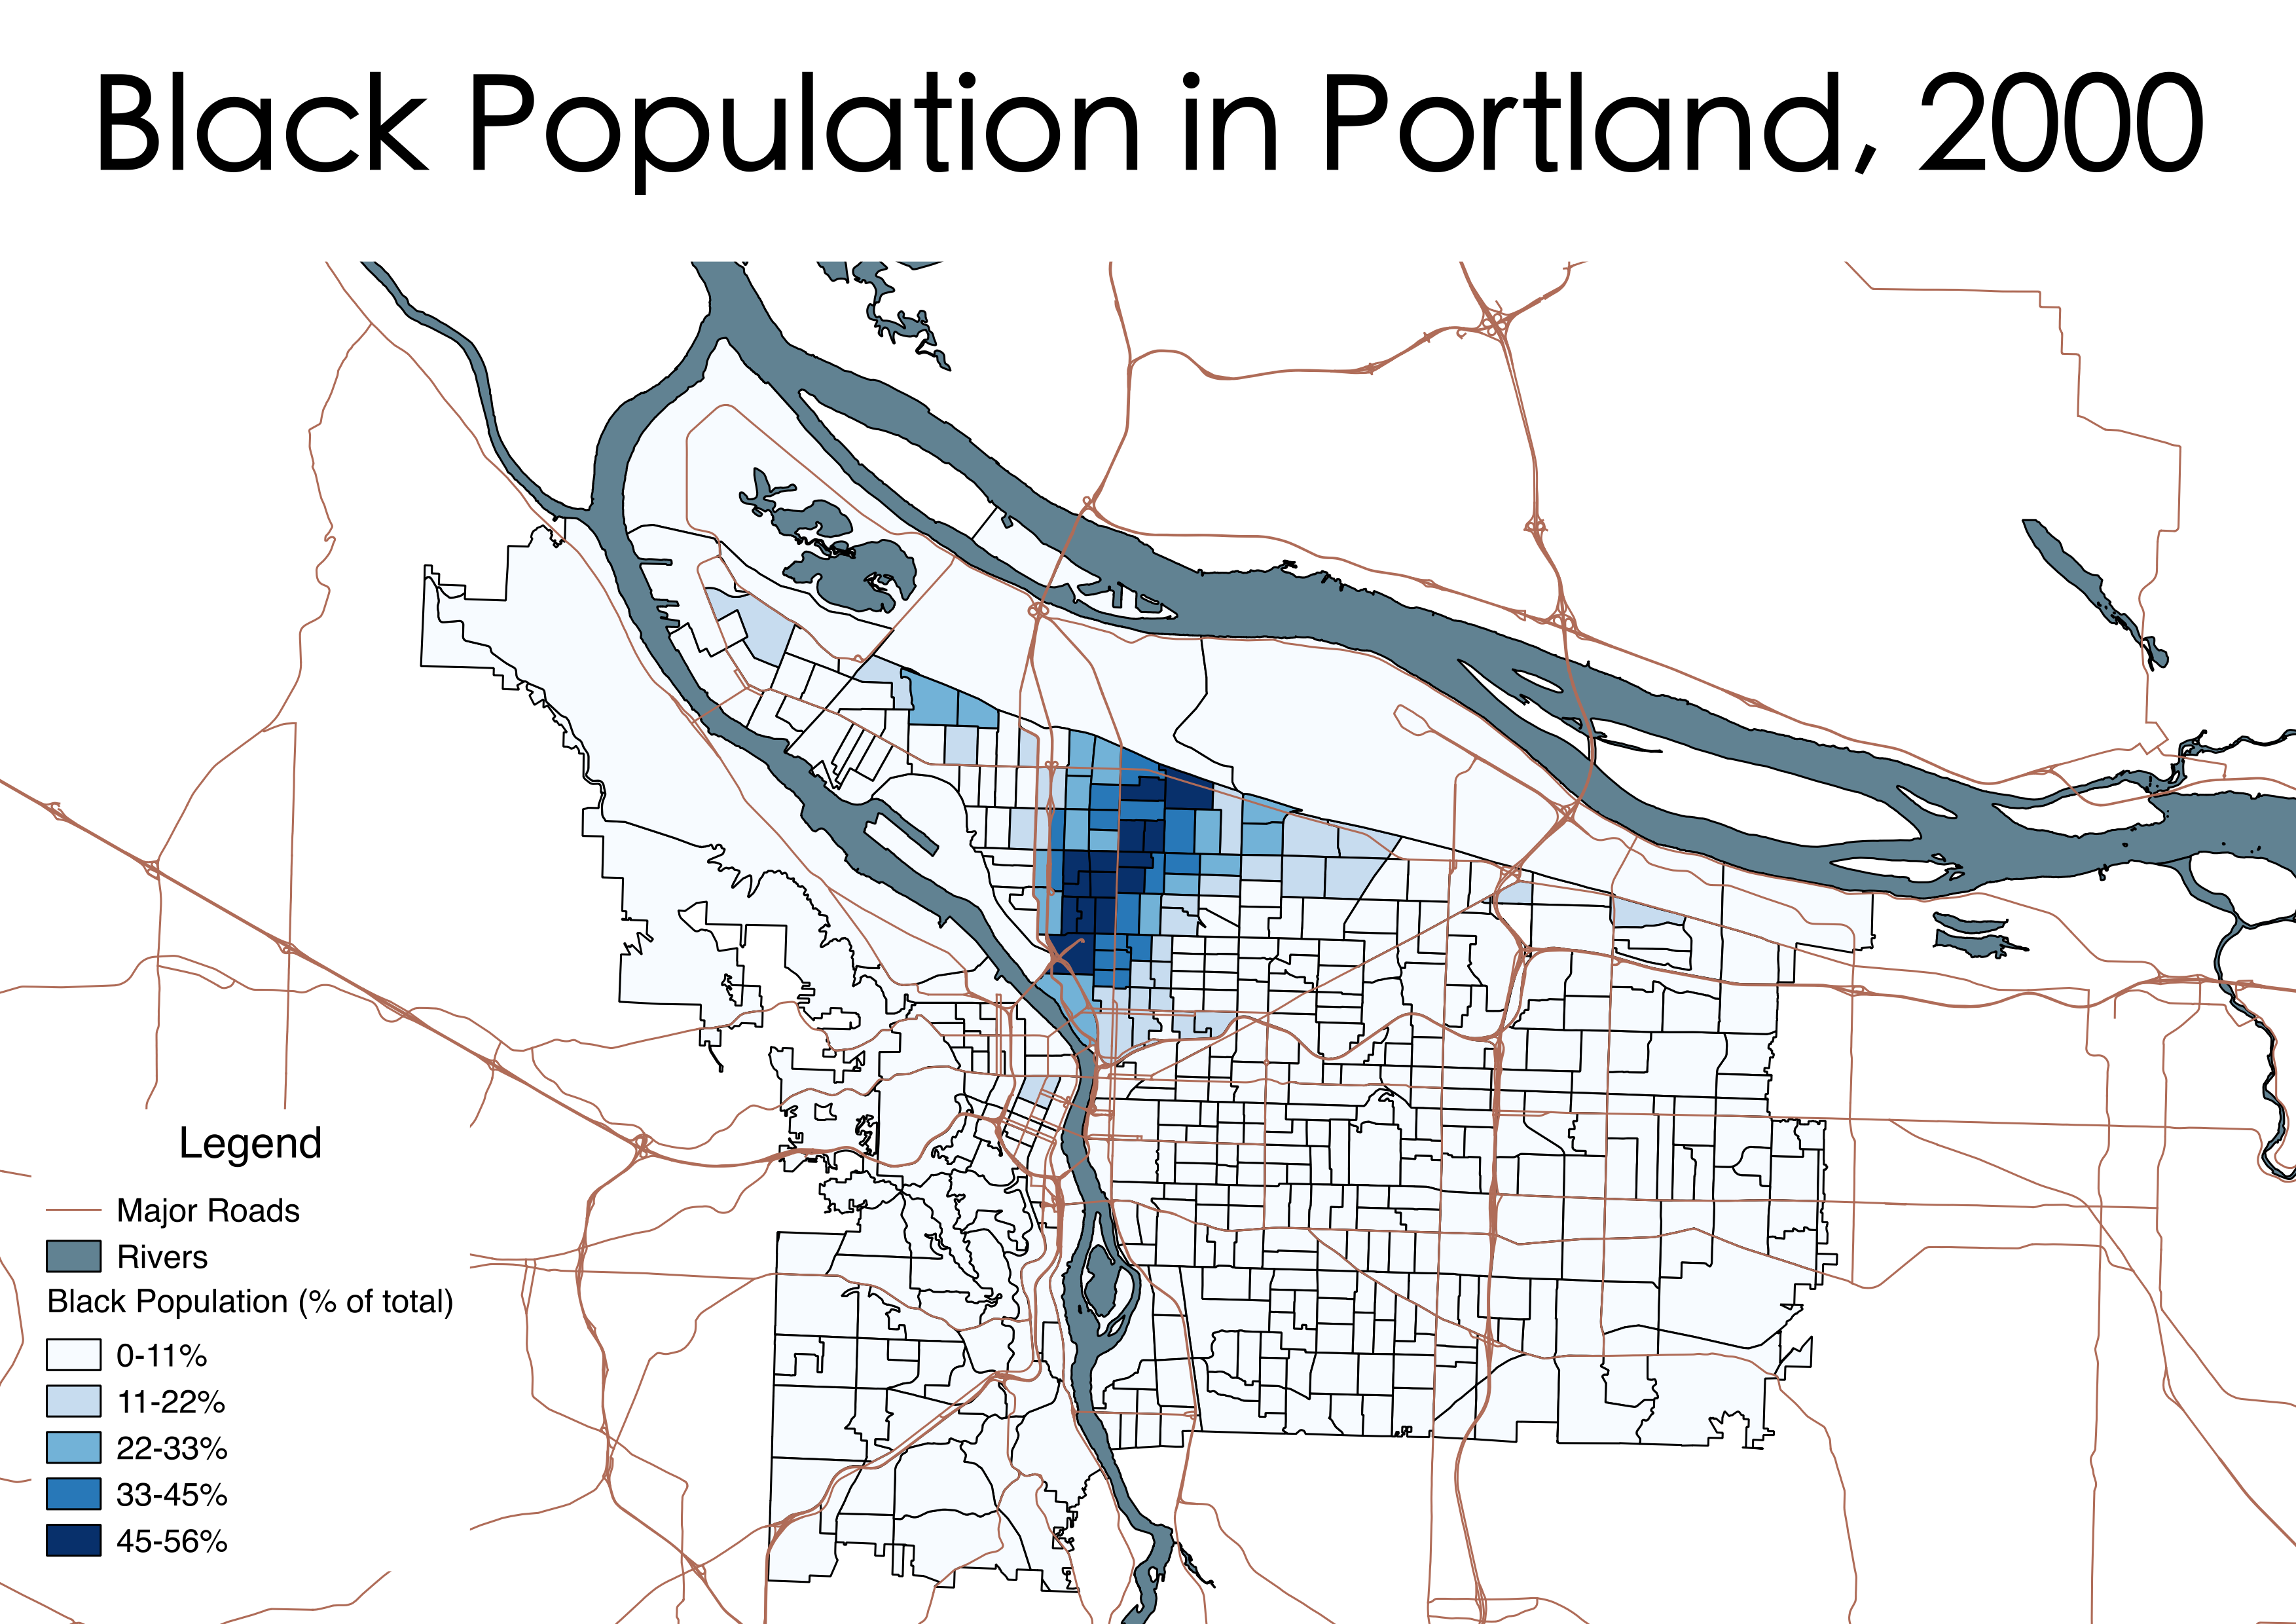
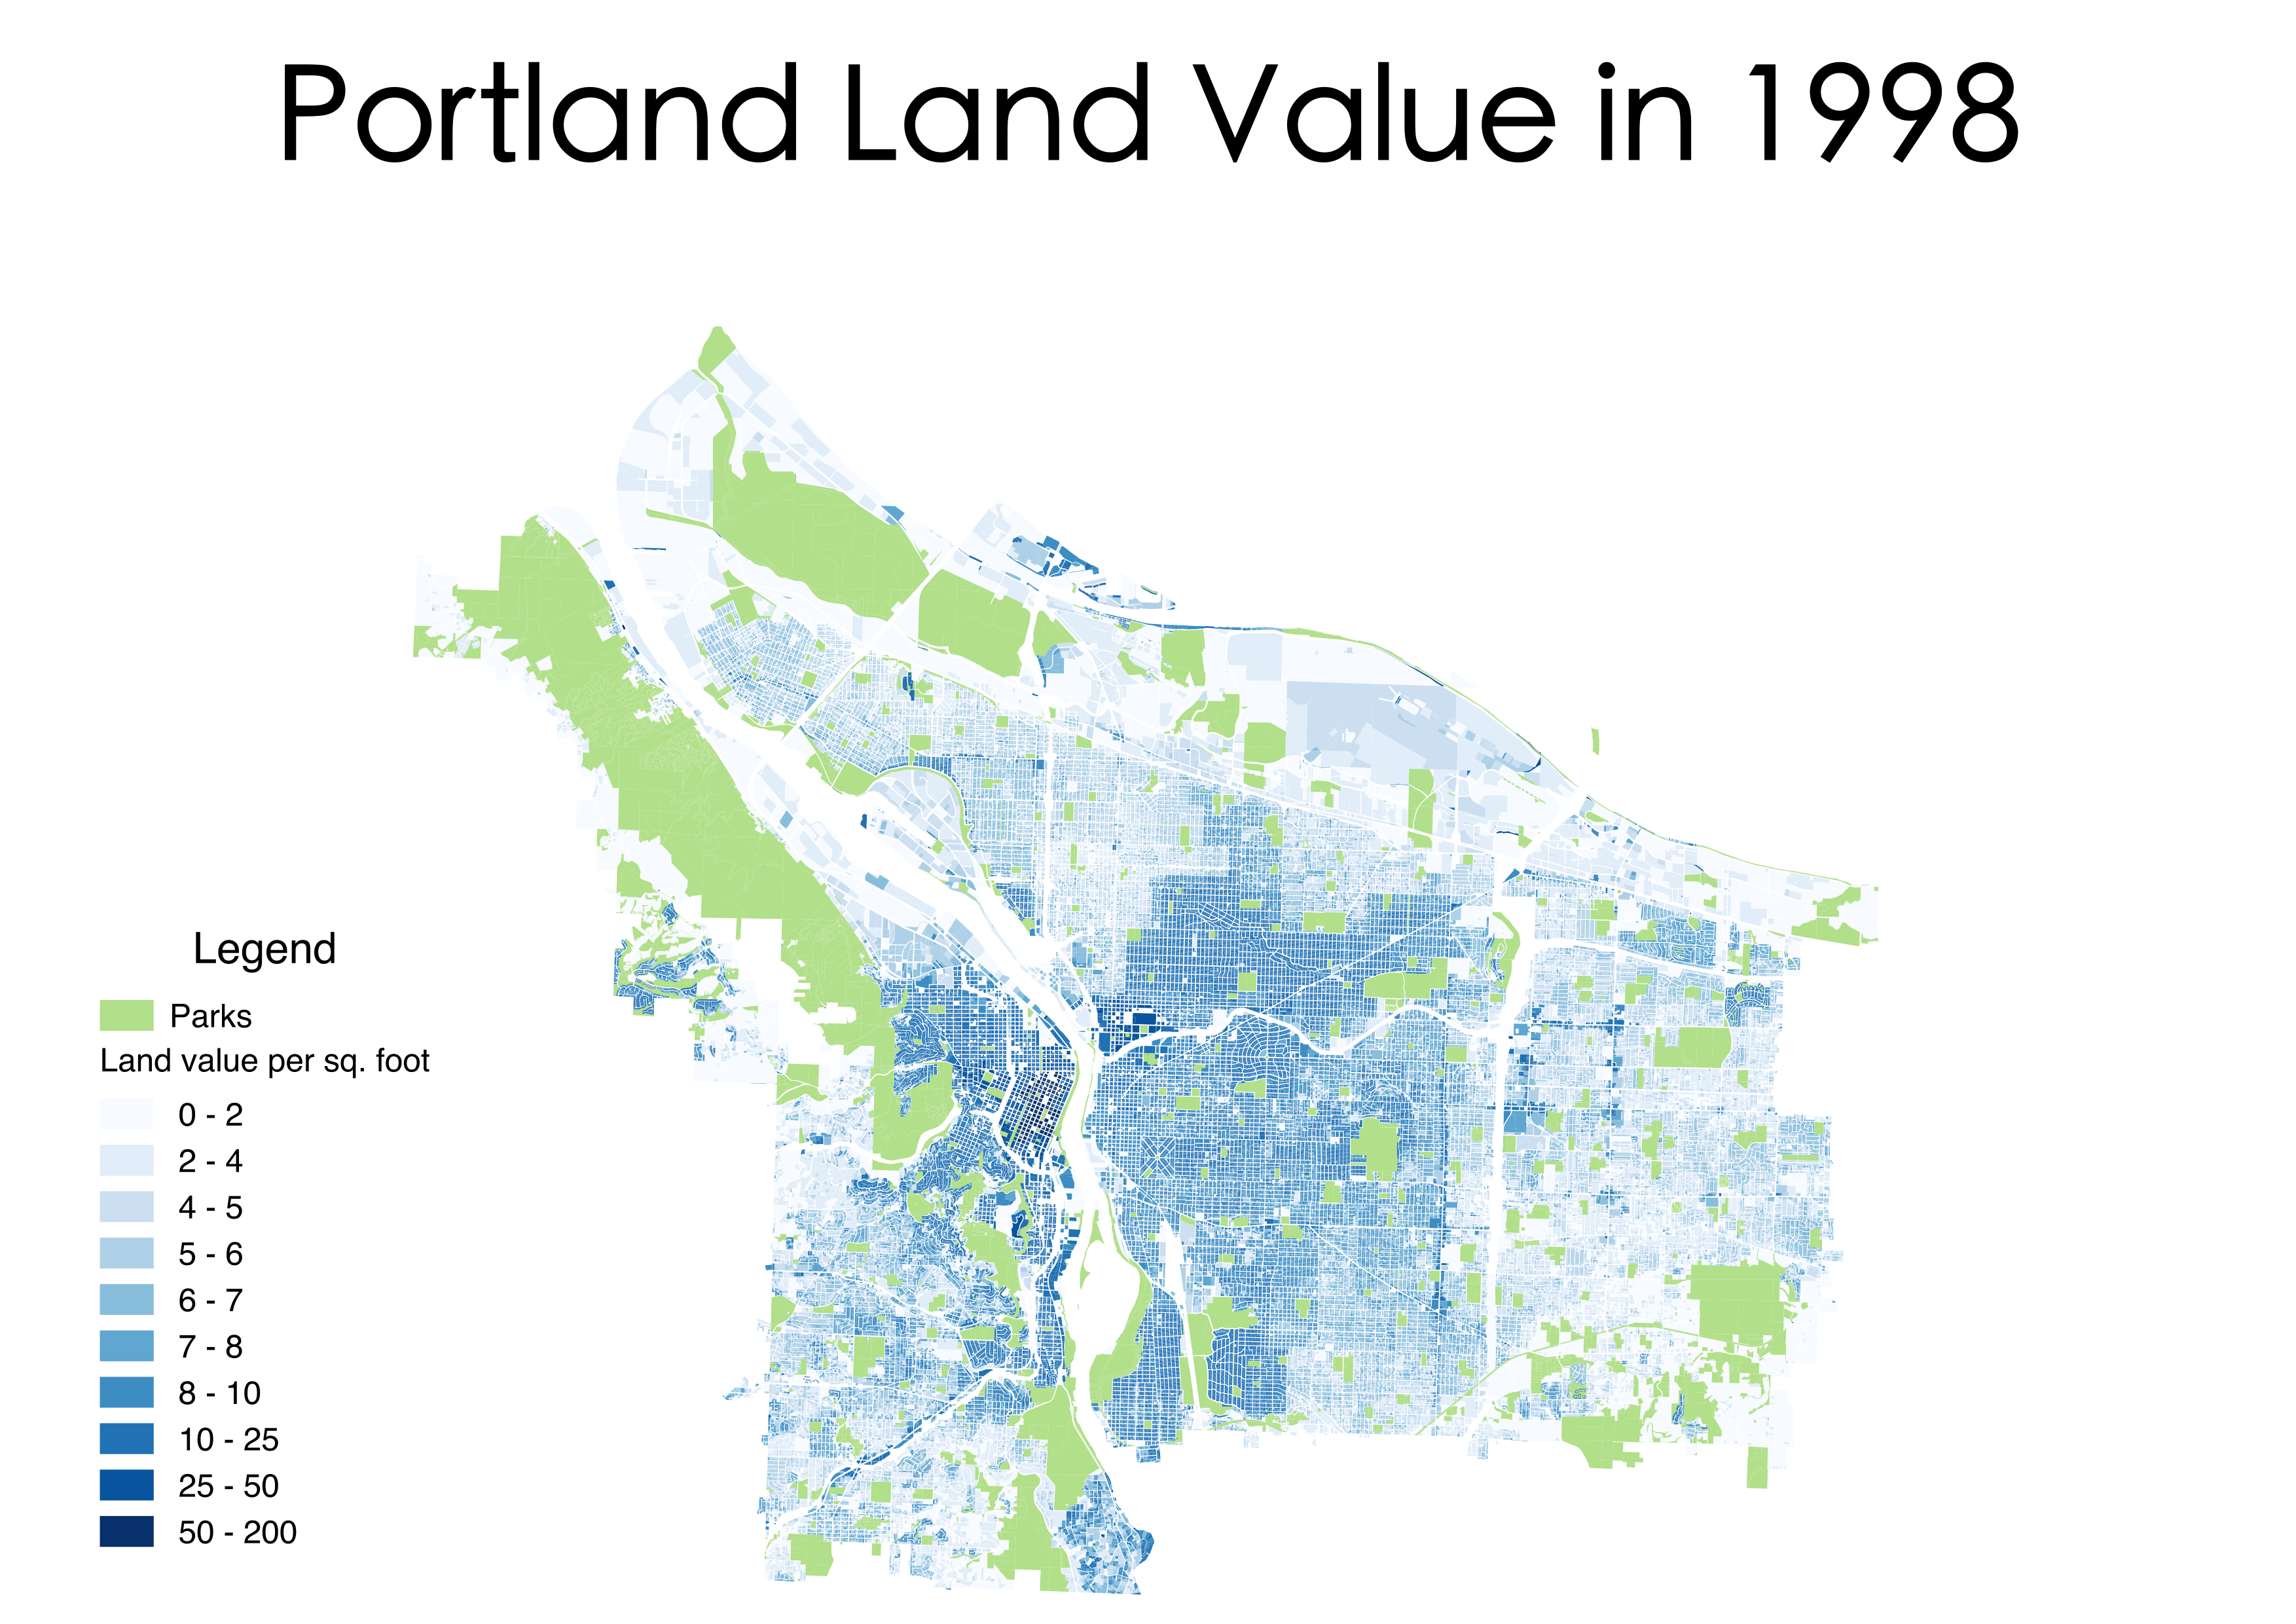
Portland has undergone significant gentrification of its inner neighborhoods concomitant with an internal racial restructuring in which poor and minority residents have been displaced from relatively central neighborhoods to the decidedly suburban locales east of 82nd Avenue. (Goodling, Gamal, McClintock 2015) This pattern is visible in a map of the change in percent of white residents by census tract from 2000 to 2014 (figure 2.1). The driver of this restructuring of the spatio-racial shift was rapid land appreciation in historically black and disinvested North Portland. Figure 2.2 shows land appreciation of all of the taxlots in the Portland metropolitan area between 1998 and 2015. North Portland taxlots experienced land value appreciation above 500% for the whole seventeen year period, with many lots appreciating between 1,000% and 1,500%. These areas of intense appreciation were significantly devalued in 1998 (figure 2.4), providing visual confirmation of the presence of a rent gap in North Portland in 1998, and its subsequent exploitation through gentrification. These geographies accord closely with the areas of black population in the 2000 census (figure 2.3) and the boundaries of both the Interstate-Corridor urban renewal area, instituted in 2000 (figure 2.5) and the Albina Community Plan, created in 1993 (figure 2.6) . These municipal projects are intended to the upgrade areas perceived to be underutilized and in need of reinvestment. This reinvestment and filling in of the rent gap has equated to substantial racialized displacement.
-

- Figure 2.1 Regional change in percentage of white residents by census tract, 2000-2014
-

- Figure 2.2 1998-2015 land value appreciation
-

- Figure 2.3. 2000 black population in Portland by block group
-

- Figure 2.4. 1998 land value
-
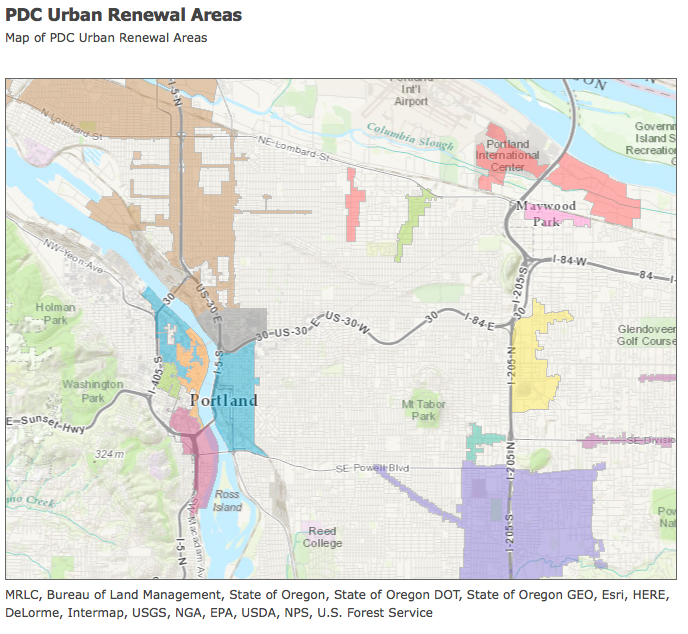
- Figure 2.5. Urban renewal areas—Interstate-Corridor in brown
-
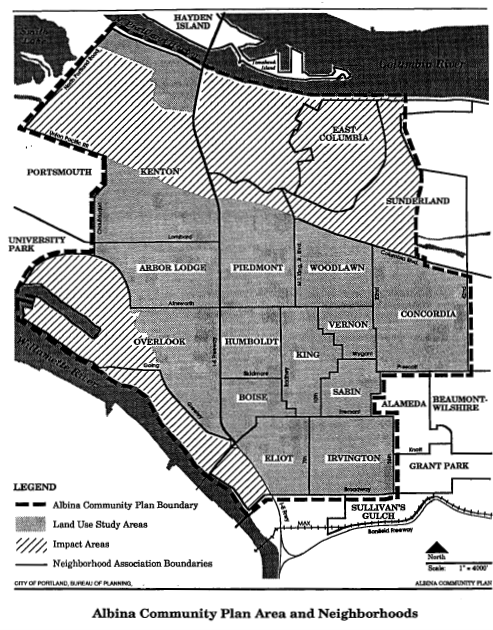
- Figure 2.6. Alaina community plan area