Note: Some links on this page may be to archived resources.
Though they are potentially useful, they are not fully functional.
Background

Environmental scholarship is about connections…the connections that matter. It’s easy for environmentalists to say “everything is connected to everything else” (Barry Commoner), but this doesn’t tell us how and why things work, and how we can possibly influence or change things. Our ENVS Program encourages students to focus on the relations between issue-specific actors and processes that connect these agents in networks, in an approach broadly known as actor-network theory or ANT, so that we can better understand—and hopefully change!—the world.
We often draw concept maps (Cmaps—also called mind maps) of actors and processes in our ENVS courses; here is an archived help page. Basically, concept maps have two things: concepts (actors, represented by boxes), and propositions (processes, represented by arrows connecting boxes). Think of concepts as nouns and propositions as verbs; concept maps thus create a textual as well as visual representation of reality.
But mapping actors and processes involves more than just knowing how to do a concept map! Let’s first compare better and worse concept maps, then offer a scoring rubric so you can make sure and do good a high-quality job of mapping actors and processes.
A bad example
 Let’s start with, well, a bad actor-network map. This map summarizes how people often talk about climate change: they call it something general like “global warming,” and they attribute it to just one or two vague causes, like “capitalism” or “overpopulation,” without specifying exactly how these causes result in global warming (thus the “??” labels). Also, note how the only actors are humans (capitalism and overpopulation); the nonhuman component (climate, or “global warming”) is simply acted upon; this is a no-no in actor-network theory, which includes nonhuman as well as human actors. So, here are some key conceptual problems with this actor-network map:
- Its key actors (concepts or boxes) are overly general, thus vague
- Its key processes (propositions or arrows) are unspecified, thus no clear cause-effect relationship
- It separates humans (actors) from the biophysical world (which is simply acted upon)
There could have been other ways to make a bad actor-network map; for instance, it’s common to include too many actors and processes, with no clear delineation of the connections that matter. But for now, just remember that good actor-network maps have a wide range of clear, specific actors with clear, specific processes connecting them.
It is possible for the above actually to be a useful, if bad, ANT map, in that it can reveal our vague understandings about things—here, that capitalism and overpopulation are somehow responsible for global warming. As a good direction, then, to take your ANT maps, try to go from more general to more specific actors and processes as your understanding of a phenomenon improves.
A better example

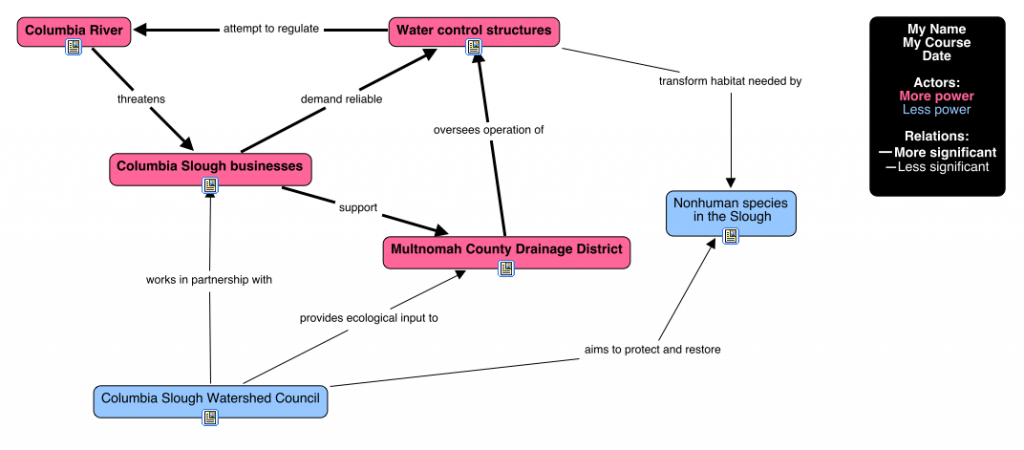
Now, let’s consider a better (not perfect!) actor-network map; this one is of a few key actors and processes shaping the Columbia Slough in Portland, Oregon, a watershed known for extensive industrial development and low-income settlement as well as a series of Slough channels and related habitat. One important challenge in the Columbia Slough, given its historical role as a floodplain of the Columbia River, is to keep water from infiltrating the many warehouses and other industrial establishments (as well as Portland International Airport!) located there; this will be the basis for our ANT map, as it defines many of the more powerful actors in the Slough.
Though it’s possible to do a reasonable actor-network map at larger scales, a situated context such as the Columbia Slough can really help. Let’s note some key strengths of this ANT map, first contrasting it with the map above:
- The key actors are specific: not just “nature” and “society,” but the Columbia River, water control structures, and the Columbia Slough Watershed Council! (There arguably are other key Columbia Slough actors missing from this diagram; for now, simply note that they are much clearer than the highly general terms used above.)
- The processes that connect these actors are all (briefly) specified: for instance, Columbia Slough businesses demand reliable water control structures, which thus attempt to regulate the Columbia River.
- There is a diverse range of actors, including hydrological systems, engineering works, nonhuman species, and public and private institutions, all interrelated—pushing and pulling each other—via a variety of processes. These arguably cover the full range of processes Sack summarizes via nature/social relations/meaning (info here), or that contribute to the making of a place (see here).
- The formatting scheme (as summarized in the legend) does not invoke tired old categories (e.g., “natural”/”human”) to differentiate actors/processes. In this case, differentiation is coded as per more/less powerful actors, and more/less significant processes, in the actor-network.
This is not a perfect Cmap: for instance, a focus question, to help the viewer appreciate exactly what this Cmap attempts to clarify, would be helpful. But it does avoid some of the big problems (e.g., vague concepts, no processes, tired distinctions) noted in the Cmap above.
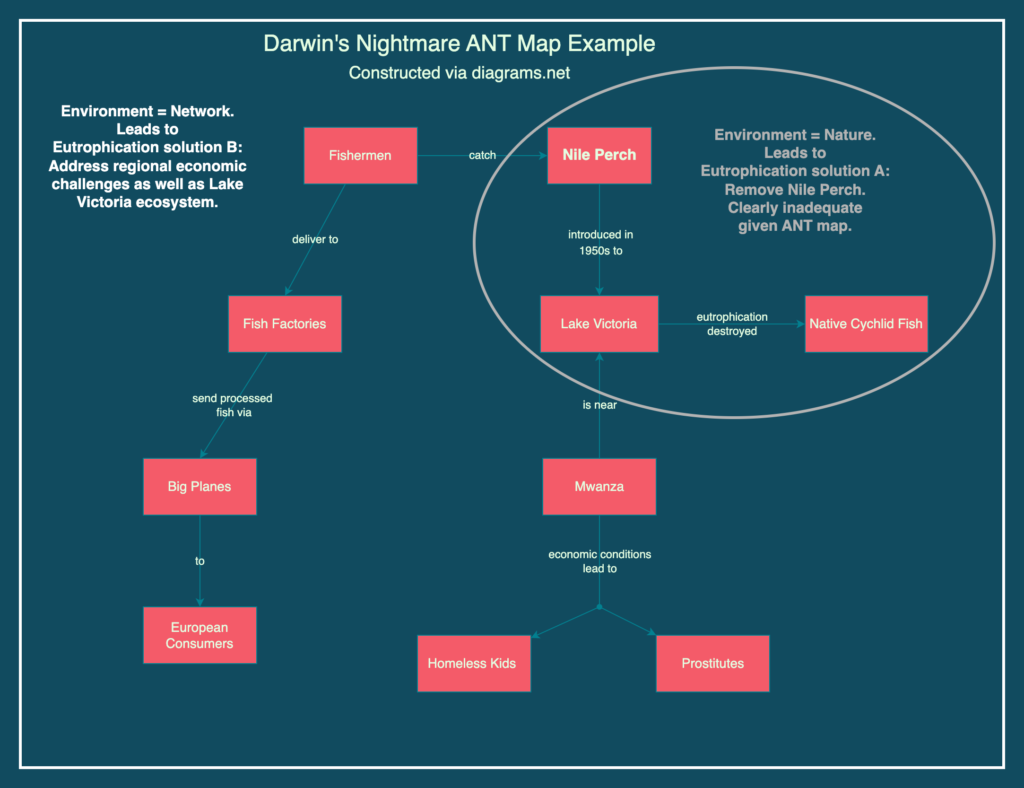
Below is another quick example of a situated ANT map, focusing on eutrophication in Lake Victoria via a portion of the documentary Darwin’s Nightmare. This ANT map also demonstrates two conceptions of environment depending on which actors are included, and leading to differing solutions to the issue.
Concept mapping tools
Here are some apps to consider as you make a concept map of actors and processes:
- CmapTools is the application used for the two top figures above. It’s free, easy to use, and you can readily install it on your computer. It is designed for concept mapping! We have used it in our ENVS Program for years. But it’s not the most aesthetically pleasing app, and unless you use Cmap Cloud you cannot collaborate on maps.
- diagrams.net is an open-source application that can make great concept maps and more; it was used for the Darwin’s Nightmare ANT map above. It works seamlessly online with Google Drive and includes desktop versions too. A similar application (now available online) is yEd Live, which in addition to diagram building offers a variety of layouts amenable to social network analysis.
- MindMeister is different from the above in that its default use is to create tree- (hierarchical) structured mind maps vs. the more open actor-network diagrams. But it offers great styles, the ability to create concept map-like connections, and important functionality the above tools don’t have, such as adding a variety of resources to concepts/actors.
A strategy
How, then, should you construct an actor-network (ANT) map? There are lots of publications on actor-network theory (e.g., Latour 2005), and there are even supposed guides for using actor-network theory to explore issues (Venturini 2009; 2010); but they are admittedly challenging. Here, then, would be one simple strategy:
- Learn about the topic or issue. There is no way you can construct a good ANT map of something you don’t deeply understand! Details take time to emerge. Try starting by asking key questions about actors and connecting processes.
- Start with a central actor. To make your ANT map relatively clear, start with an actor (box) in the middle that is the focus of your issue or topic.
- List key affiliated actors. Actor-network theory suggests that any actor is a knot in a network of relations with other actors; who would these be in your case? Note, from the Columbia Slough example above, that actors can be anything—human or nonhuman, with intentional or unintentional actions…think outside any box.
- Array these actors as proximate to root causes of change in your central actor. Proximate causes are those immediately responsible for a change; root (ultimate) causes are ultimately responsible for proximate causes. Place the proximate actors closer to your central actor, and root actors farther away, on your ANT map.
- Draw and label connecting processes. Now, connect your actors, using verb-oriented propositions to label these connections. When done, your ANT map consists of a series of (not too many!) interrelated actors (nouns) connected by processes (verbs).
- Format your ANT map and give it a legend. ANT maps are communicative tools; formatting your map helps you communicate important information. Beware of the tendency to group actors into tired, anti-ANTish categories! Consider grouping them by relative power or significance in the overall actor-network, as one useful scheme.
When done, share your ANT map with others. Does it visually communicate the reality of your issue or topic? What questions does it evoke in others? Use this feedback to improve it.
Summary rubric
Here, then, could be the elements for you to include in your actor-network maps, with a score for each (10 pts possible).
- 2 pts: Clear title, legend differentiating actors/processes, and focus question
- 5 pts: Actors (concepts/boxes) are
- The most relevant ones (2)
- Not too many, not too few (1)
- Appropriately specific (1)
- Appropriately diverse (1)
- 3 pts: Processes (propositions/arrows) are
- The most relevant connections between actors (2)
- Appropriately specific (1)
You may also be asked to submit a brief text summary of your actor-network map. A good textual summary (10 pts possible) would include an embedded ANT Cmap (see concept mapping help page to embed your live Cmap), and conveys:
- 2 pts: Background and situated context of the issue you are examining
- 3 pts: Discussion of included actors, with a summary of why you chose them and what role they play
- 3 pts: Discussion of key processes connecting actors, with a summary of resultant network links, disconnects, and feedbacks (acceptable if merged with discussion of actors, but make sure to initially mention key actors and why chosen)
- 2 pts: Summary and implications for understanding, and/or successfully addressing, the issue
Mapping actors and processes is hard work—just as hard as writing a good paper. For many students, though, this visual exercise can be immensely rewarding.
References
- Latour, Bruno. 2005. Reassembling the Social: An Introduction to Actor-Network-Theory. Oxford: Oxford University Press.
- Venturini, T. 2009. “Diving in Magma: How to Explore Controversies with Actor-Network Theory.” Public Understanding of Science19 (3): 258–73. https://doi.org/10.1177/0963662509102694.
- ———. 2010. “Building on Faults: How to Represent Controversies with Digital Methods.” Public Understanding of Science21 (7): 796–812. https://doi.org/10.1177/0963662510387558.
