Background:
A survey is a way in which to perform extensive research; generalizing data by region or other populations. This narrows down data to perform intensive research in order to further understand the significance of correlations in the data. Effective surveys require a careful balance of effective questions, survey ethics, interpersonal communication skills, and data analysis. Forming appropriate survey questions can depend on the larger research question you are attempting to answer, and can range from open- to close-ended questions in various ways.
Fields dinning hall, the on-campus food service catered by Bon Appetite, has developed a number of quirky stereotypes, jokes, and lingo throughout its existence at Lewis and Clark. A common scenario described by students highlights the anxiety felt when one scans the crowds of eating students in search of a friendly face to sit with. This feeling has been dubbed, Bon anxiety. We decided to survey Lewis and Clark students to find out what times or ways they most acutely feel Bon anxiety, and what they think can be done about it. We felt like this would help generate correlations betweens the types of eaters at LC, the amount of anxiety, and the suggested responses of Bon anxiety. The general information that we find about this topic can help us to narrow in on particular people with characteristics we deem important in finding out more about Bon anxiety.
Methods:
We used the Fulcrum software to create a survey that could be mobilly administered around various areas of the Lewis & Clark College campus. Team members each took his/her individual iPads to different parts of campus to find survey takers. After fifty surveys, team members synced all data to the Fulcrum website. Once the surveys were administered and collected, we exported the data from Fulcrum into Excel. Most of our data was recorded categorically, and in order to analyze the information, we coded each category numerically (i.e. A small graduating class size is recorded as a 1, a medium class size is recorded as a 2, etc). Categories with more than one answer per person were coded using binary numerals in order to allow the information to compute. Categories with one answer per person were coded based on the individual answers.
Once all parts of the survey were coded, we imported our excel sheet into IBM SPSS Statistics in order to run a number of correlations and mean difference calculations between different parts of the survey. We ran these tests on most areas of our survey, searching for significant correlations. We compared information such as the average number of bon meals eaten alone and the the meal with which the most bon anxiety is felt or the size of a high school graduating class and the average number of bon meals eaten alone. All of these tests tell us different things that can help us find out which parts of our survey are the most important.
Results:

Fig. 1
Fig. 1 shows the Pearson Correlation between the size of the graduating class of the people we interviewed and whether people feel internal or external anxiety in the Bon. The P-Value was recorded at 0.127: not statistically significant.
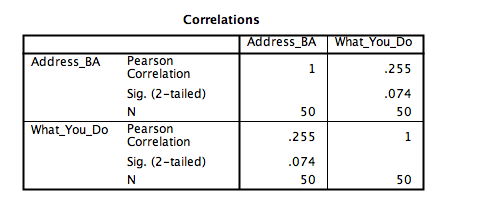
Fig. 2
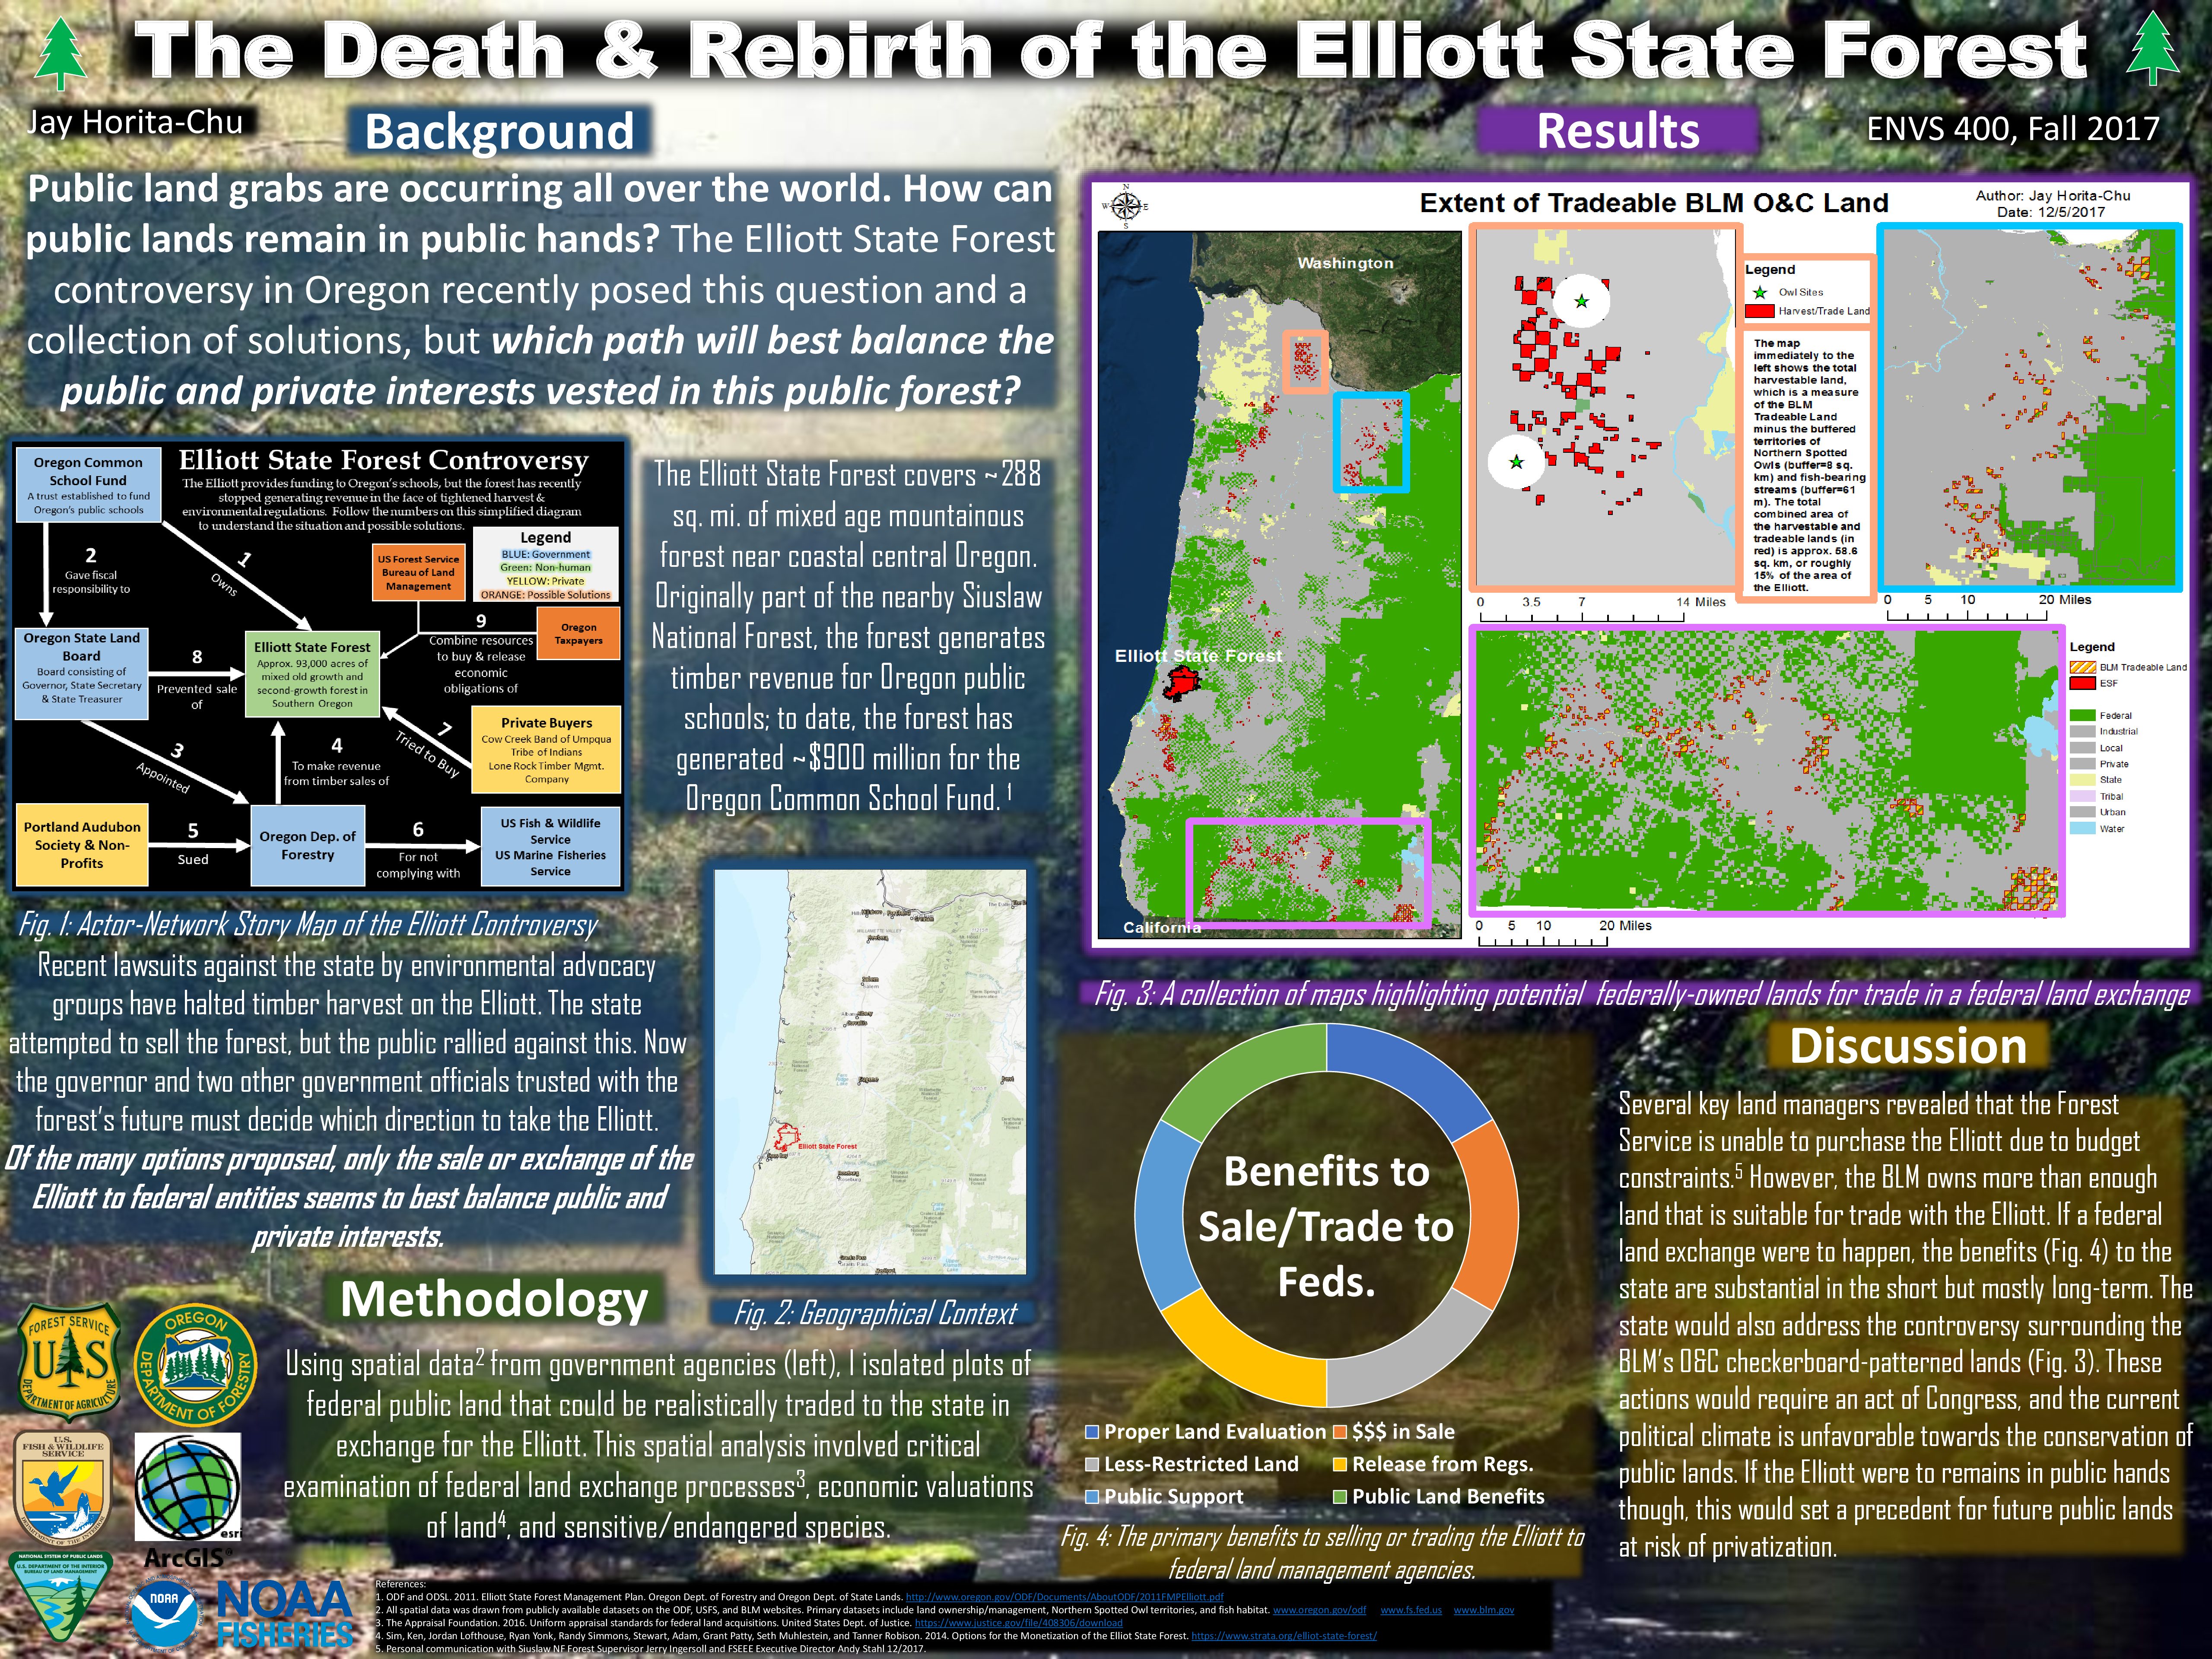
Fig. 2 shows the Pearson Correlation between whether or not the individuals we interviewed believed bon anxiety should be addressed as an issue and what they do when they are eating alone in the Bon. The P-Value was recorded at 0.074: not statistically significant.
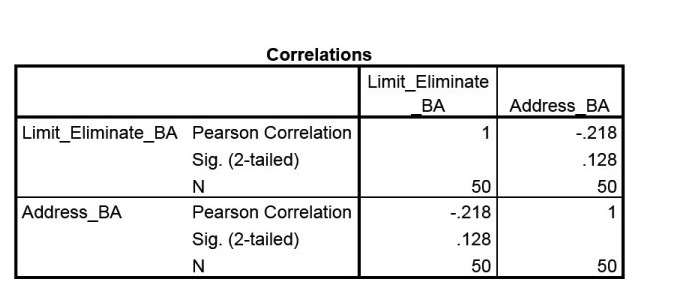
Fig. 3
Fig. 3 shows the Pearson Correlation between how the individuals we interviewed believed Bon anxiety could potentially be limited or even eliminated entirely and whether or not they believed that Bon anxiety should be addressed as an issue. The P-Value was recorded at .128: not statistically significant.
Fig. 4
Fig. 4 shows a positive Pearson Correlation value between the survey takers’ beliefs in how Bon Anxiety can be limited or even eliminated and which meal that the most bon anxiety is felt at. The P-Value was recorded at .036: statistically significant.
Discussion:
Interestingly, all but one of our correlation tests returned non-significant results. For the purposes of this lab then, we cannot draw solid conclusions from our data. Some tests, such as those illustrated in Fig. 1 and 3 for instance, initially seemed as though they would undoubtedly return significant results, but this lack of a strong relationship suggests that 1) LC students are undecided on their views on Bon Anxiety and/or 2) Our questions were not effective in allowing survey takers to voice their opinions and/or 3) Not enough surveys were conducted. Fortunately, there was one statistically significant relationship: see Fig. 4. In interpreting this relationship, we can find that those who have the most bon anxiety during dinner (as opposed to breakfast or lunch) also feel as though having reading materials at tables for students sitting alone would limit or eliminate Bon Anxiety. While we may have only found one significant relationship, there a few other comparisons that returned near-significant P-values (see Fig. 1, 2, 3), alluding to the possibility that a greater number of surveys with questions that allow polarization would yield significant relationships. Additionally, we can conclude that there would be a benefit to the community by providing the PioLog, the NY Times, or various other magazines and reading materials for use in the Bon, especially to those tables designed primarily for individual use. Overall, this lab helped ENVS 220 students develop their survey synthesis, execution, and analysis skills tremendously.