Overview
ENVS220 has been one of my first classes at Lewis & Clark College and my introduction to the ENVS program here. Reflecting on how this course has come to complement my education at previous institutions, I have found that this course has helped me in learning hard skills (i.e. using GIS, pulling raw data from public sources) and critical analysis (questions, situated contexts, and real-world applications of research). This course is very similar to another skills course I took during my freshman year at the University of Aberdeen called BI1006 Biology for Undergraduates. Unlike biology courses though, ENVS 220 takes a much broader view of environmental issues across the globe, but this broad focus is complemented by labwork, which takes place in situated contexts. Lastly, a large part of ENVS 220 was building a concentration for majors.
Concentration of Studies
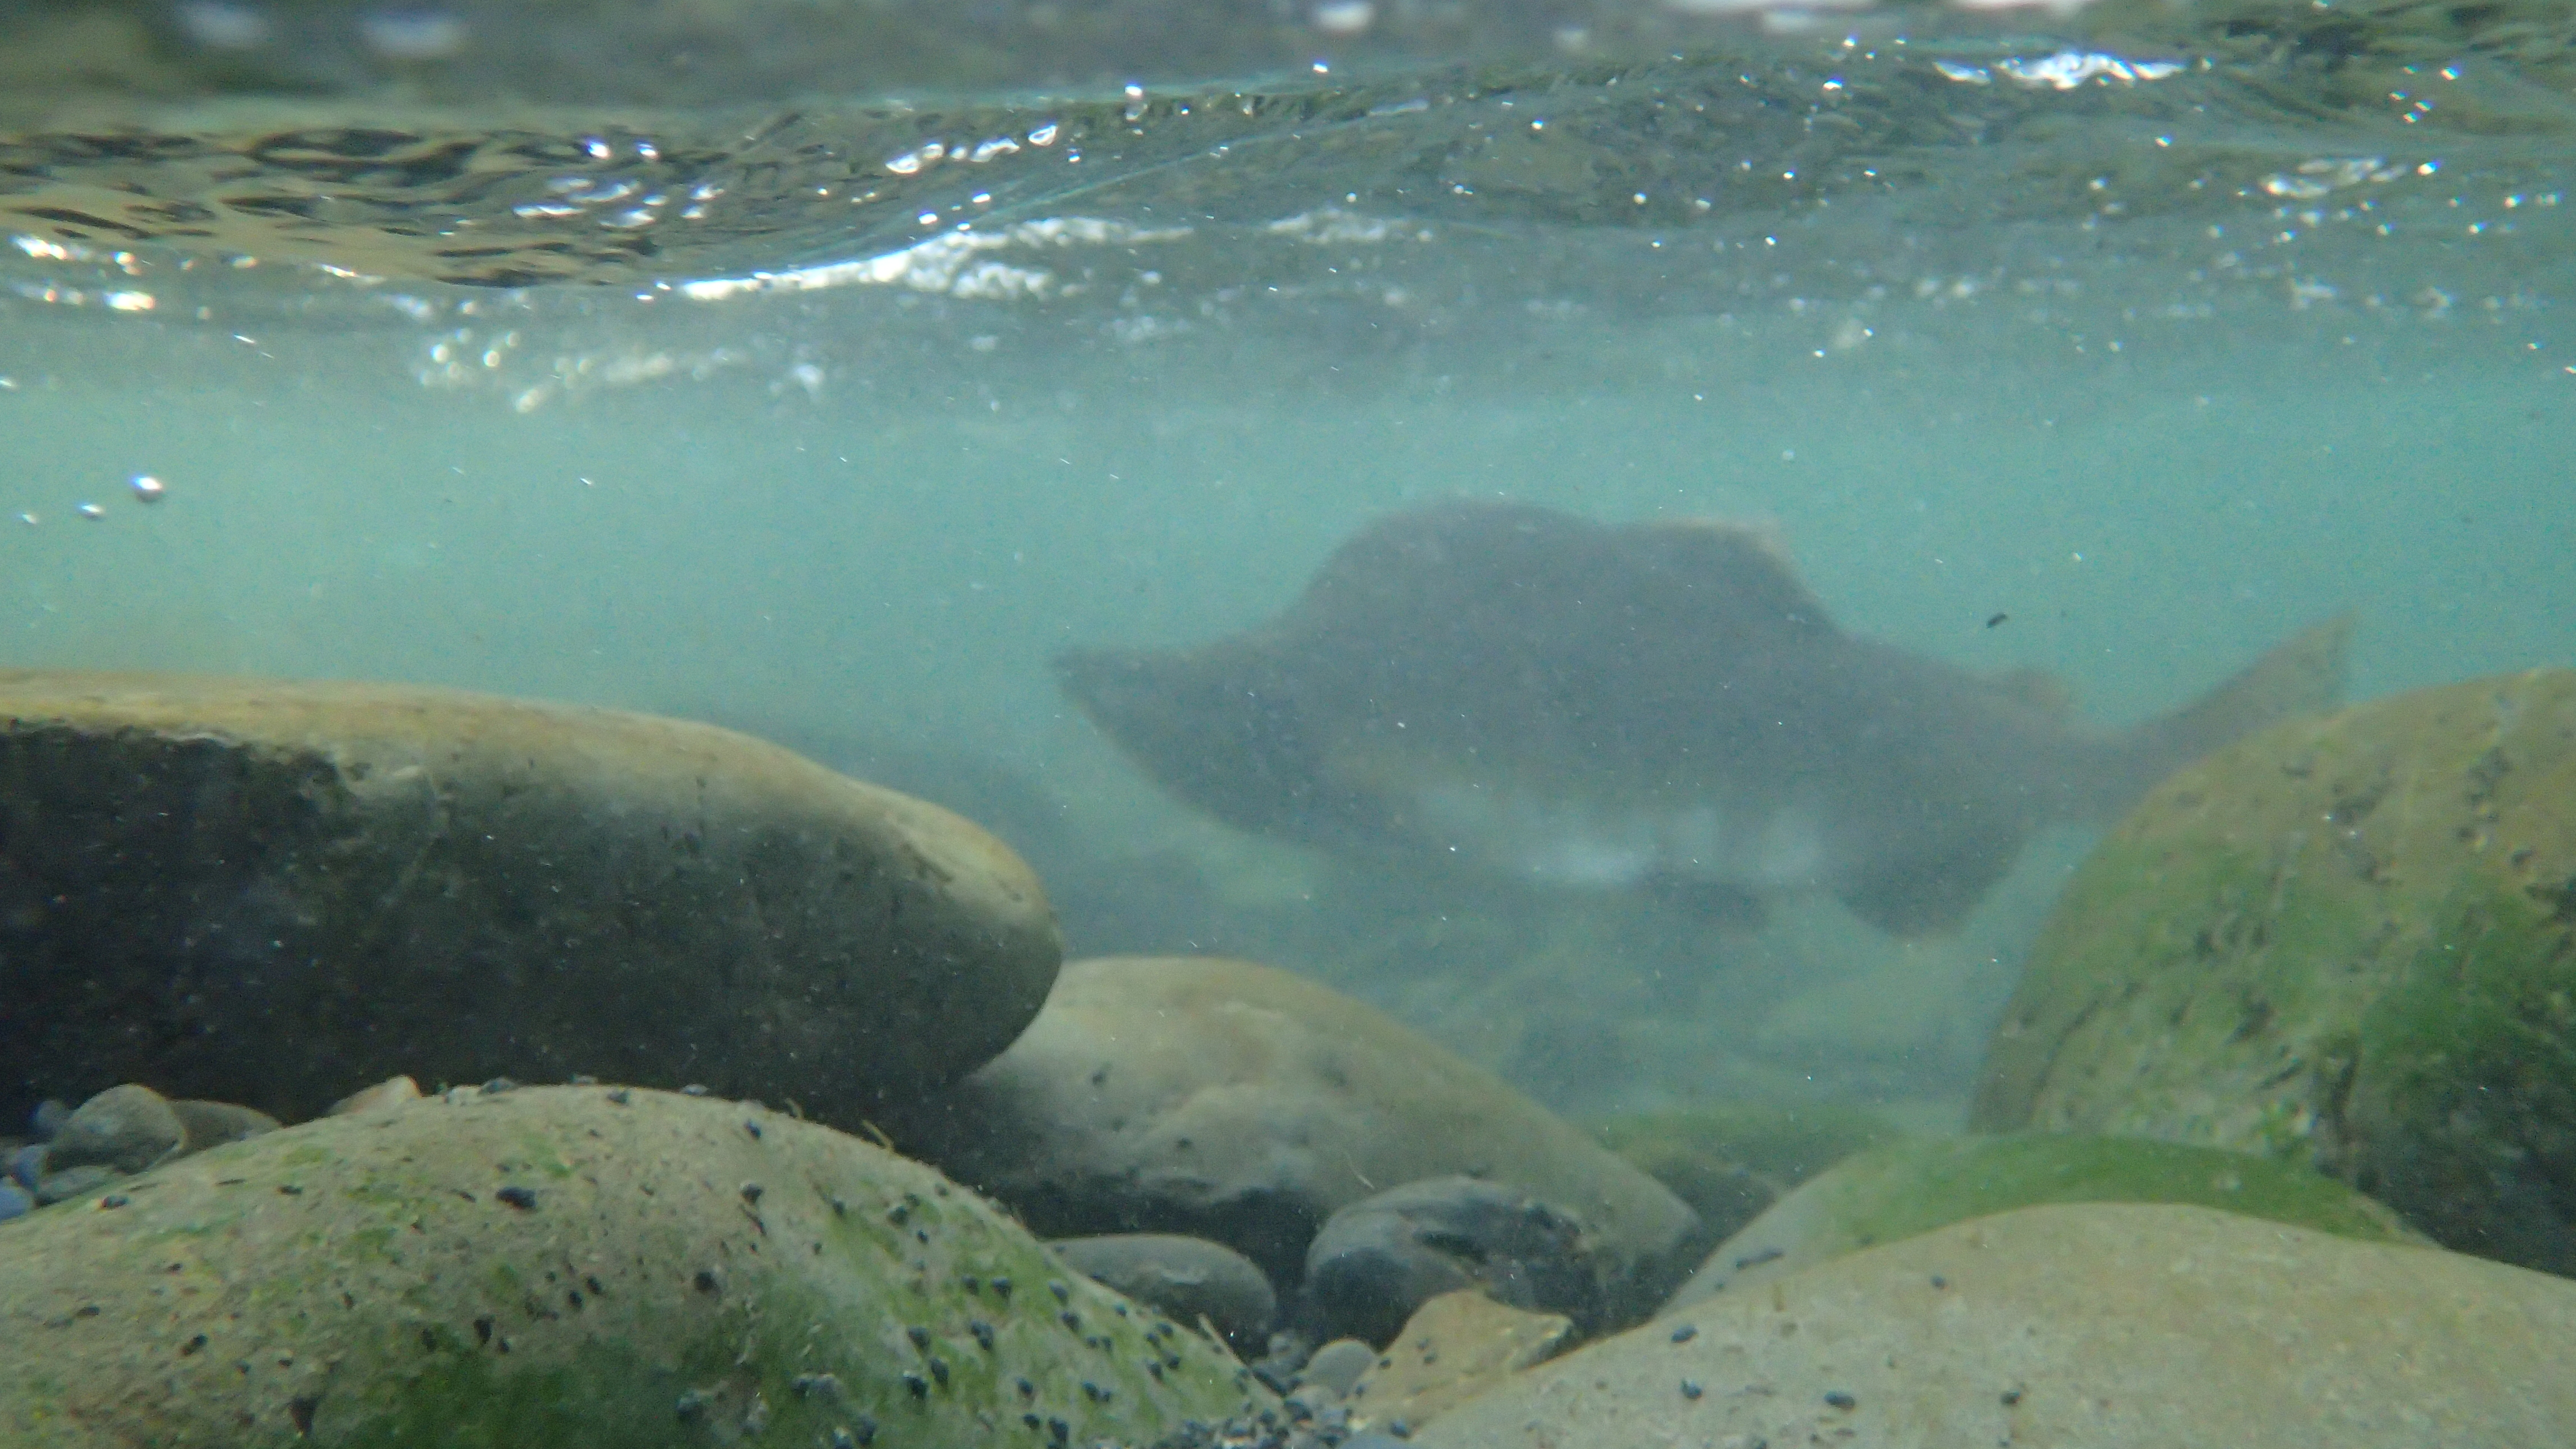
Pink Salmon. Shot in a small river near Hope, AK
A large part of the ENVS 220 course is concentration synthesis – through constant feedback with our advisors and in-class sessions, students develop questions to their concentration topics, and from these questions arise situated contexts and the concentration proposal. My concentration observes salmon conservation techniques -from aquaculture to restoration ecology to dam de-construction – across various geographic areas of the world with the aim to understand what conservation measures have been, are, and will be the most effective and practical. This process has undoubtedly been simultaneously the most challenging and the most enjoyable aspect of ENVS 220, for creating a feasible yet meaningful concentration requires careful reviews of numerous primary and secondary literature of a broad topic. Here is a page with a chronological order of how my concentration started and where it is today. Does not include all posts related to my concentration (see here for all posts related to my concentration.
Labs
Another large part of ENVS 220 is labwork. Through weekly sessions, students get hands-on time with a broad range of practical skills – from survey construction and execution to creating and interpreting maps in ArcGIS to designing field environmental science techniques. Personally, I’ve gained the most so far from labs dealing with real data available publicly. Click here for a list of all write-ups for ENVS 220 labs.
- Lab 1: RVNA: In this lab, we studied how altitude and canopy cover affects microclimate factors, specifically temperature, humidity, and dew point within the River View Natural Area (RVNA), a 146 acre public-use park characterized by mixed deciduous and evergreen species and located in southwest Portland, Oregon.
- Lab 2: GIS: In this lab we used ArcGIS, a mapping application intended for spatial analysis and mapping. ArcGIS has an advanced toolbar of options for creating maps and spatial analysis. We drew publicly available data on certain topics such as country income, life expectancy, etc. We layered this data into ArcMap to see spatially what kind of relationships between country characteristics may exist. Click here for the full writeup!
- Lab 3 Inferential Statistics: We pulled raw data from UNEP and required students to compare and contrast various global trends in a wide range of variables. My team looked at healthy average life expectancies and total percentage change in agricultural output in each of the countries where data was available. We found the two variables had a significantly negative relationship, and in attempting to explain this, we found the quinoa vs. farmer health example satisfied this trend.
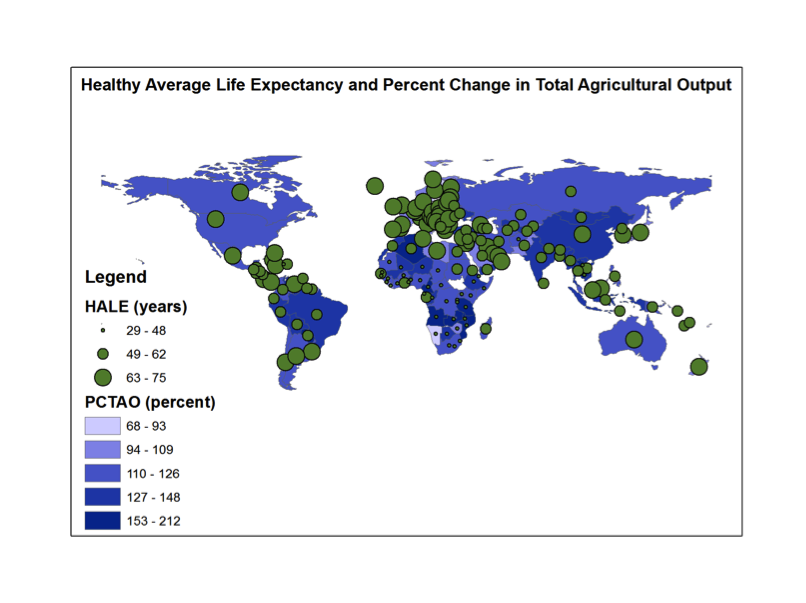
HALE in green dots, PCTAO in shaded blue
- Lab 4 ArcGIS: We used our two variables from Lab 3 and converted the tabular data into spatial data using the industry standard ArcGIS software. This was an enormously useful session that helped us see how data can seem so different from one form to another. From these two labs, I’ve concluded on the importance of observing data through multiple methods and the power/value of GIS software.
- Lab 5: Using the metro Regional Land Information System (RLIS), we gathered mapping data for freeways, major rivers, and county lines. This information allowed us to provide geographic context for toxin presence data according to Portland neighborhoods. This result was a map of Portland neighborhoods with toxin presence layered on top, revealing trends in racial segregation of neighborhoods and the presence of air toxins.
- Lab 6: Qualitative Research: In this lab, each lab team chose a different work within the popular environmental literature genre. Ultimately, our goal was to
.jpg)
“Blessed Unrest” was my team’s literature choice.
quantitatively observe how these books (around 12 in total with lab groups combined) approached environmental issues; were they global vs. local? Optimistic or pessimistic? In creating a standard methodology to “rate” these books, we could get an idea of how popular environmental literature as a genre approached environmental issues in global/local, positive/negative views
- Lab 7: Social Network Analysis: Networks explain the ways in which different components of a system connect. These connections can be between people, places, computers, even internet sites. In order to understand how these networks operate, the connections are mapped using a number of tools, and can be presented in a number of different ways. In this lab, we analyzed and presented social networks within our ENVS 220 class.
Synthesis Posts
These posts take a remarkedly personal and reflective approach to my view of the ENVS 220 course compared to the previous two categories. While definitely not new to the biological sciences, ENVS 220 has been my introduction into my major here at Lewis & Clark College, so these synthesis posts are not only about the ENVS 220 course but are often about my first impressions with the L&C Environmental Studies program. Click here for a list of my synthesis posts so far for ENVS 220.
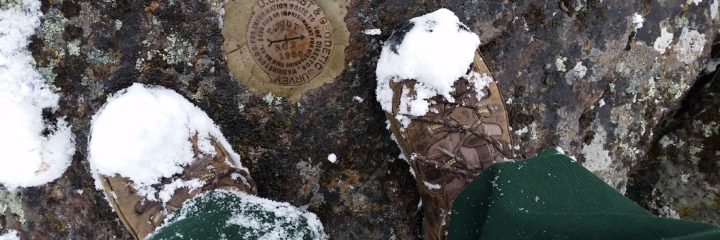
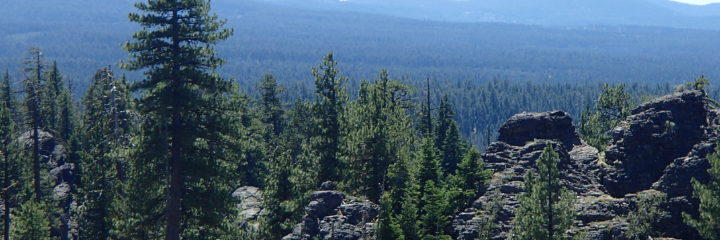
2013 Trails Intern, Fremont-Winema NF, Oregon