Using land cover data collected for the 1995 study, we were able to observe and calculate the spatial distribution and relative quantity of benthic land cover types in the Willapa Bay area (at the time of data collection: 1995). The below figures are the outcomes of our attempts to display the land cover data using ArcGIS and Google Sheets software.
Context: The authors of the study “…acquired 295 true color aerial photographs (1:12,000) of Willapa Bay, Washington, from the State of Washington Department of Transportation (WDOT), suitable for the interpretation of submerged rooted aquatic vascular plant populations” to create a GIS representation of the land cover types. The accuracy of the findings were either verified or invalidated by comparing with another set of aerial photographs and data obtained from field videography efforts. In addition, field observations were conducted to verify the land cover type.
Actions: In this lab, we split land cover types into several categories according to the System for Classification of Habitats in Estuarine and Marine Environments (SCHEME), and of the seven main land cover types, five were present in notable quantities in Willapa Bay: Land, Submersed Aquatic Vegetation, Tidal Marsh, Unconsolidated Sediments, and Unknown Benthic Habitat. Definitions of these land cover types can be found at this link. While some of these categories have sub categories, for the purpose of this exercise, we only looked at the parent categories. Through ArcGIS software, we were able to display the data collected in the 1995 study in various ways, shown below in Fig. 1-3 and Table 1. This lab exercise served to refresh our memories of GIS skills acquired in previous courses as well as allow us to think critically about the methods utilized in the study.
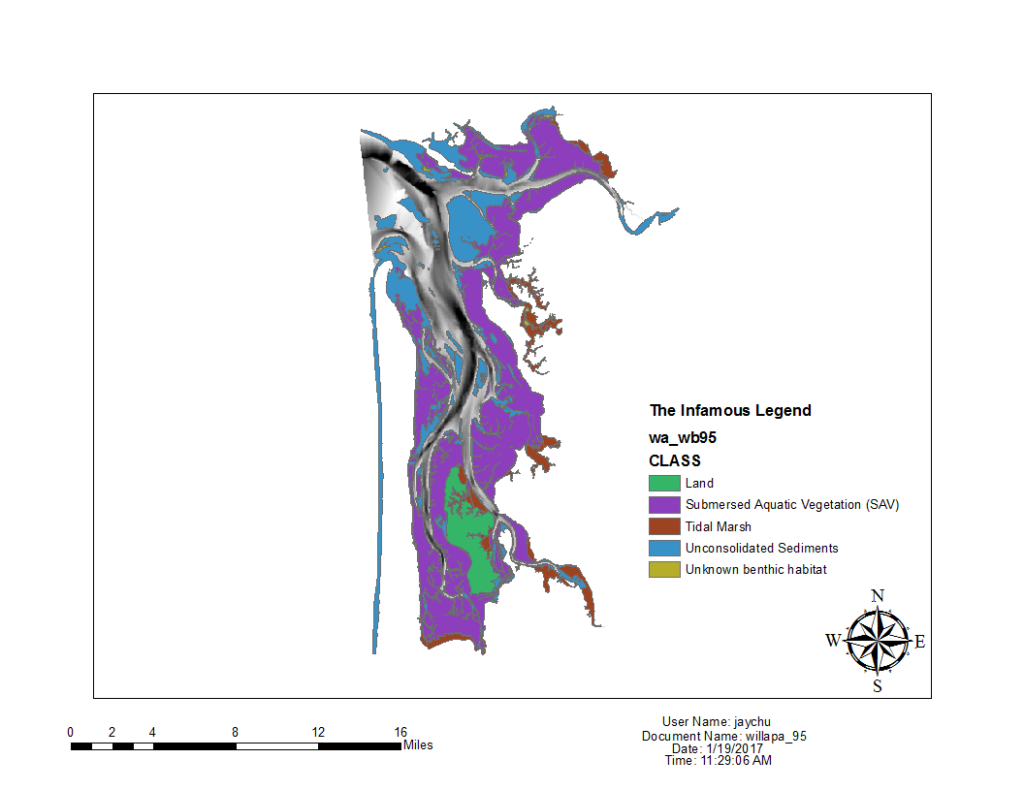
Fig. 1 Map of the Willapa Bay area (Washington) displaying different land cover types present according to a 1995 survey
| Land Cover Type | Total Area (m^2) |
| Land | 19597478.04 |
| Submersed Aquatic Vegetation | 158849391.5 |
| Tidal Marsh | 24815222.89 |
| Unconsolidated Sediments | 85452609.06 |
| Unknown Benthic Habitat | 2130795.944 |
| SUM | 290845497.4 |
| Estimated Area Using Polygon Area Tool | 301,736,226.62 |
Table 1 Numeric representation of the land cover types displayed in Fig. 1
The sum estimated by using the polygon measuring tool in ArcGIS overestimated the actual area measurement calculated by using the numeric data, and this expected result is likely due to the inaccuracy of the polygon measuring tool in calculating non-uniform shapes. In this specific example with Willapa Bay, a notable portion of the bay’s water was unavoidably included in the polygon calculation, likely leading to the overestimate.
According to a quick Wikipedia search, the Willapa Bay area is roughly 670 km^2, while our area calculations of the studied areas is roughly 291 km^2. This difference of 379 km^2 may be due to the exclusion of the water surface area in the 1995 study and the inconsistencies of the boundaries of Willapa Bay as determined in the 1995 study and the Wikipedia calculation.
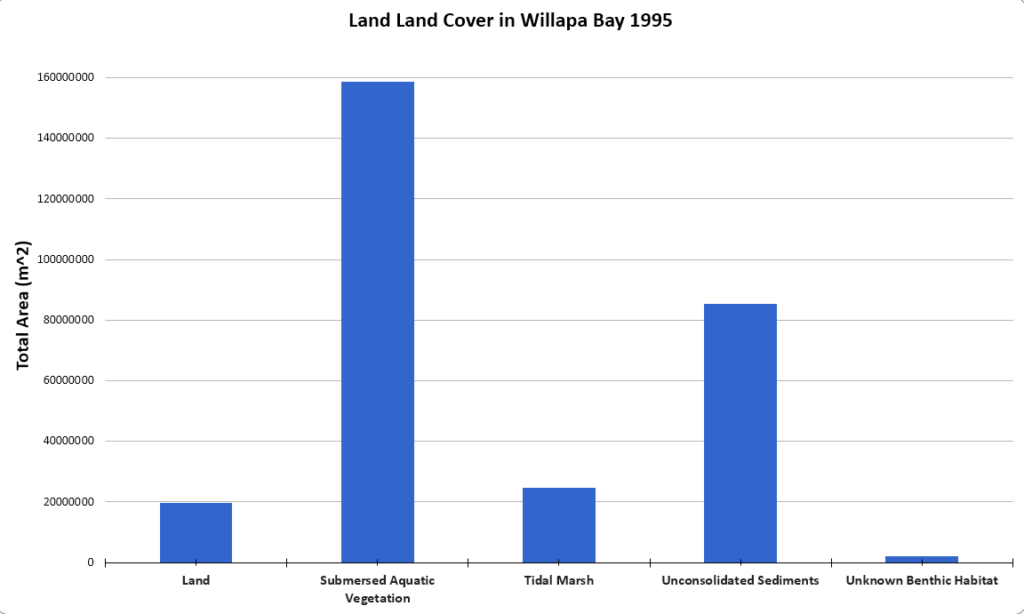
Fig. 2 Bar graph representing the abundance of land cover types. Note the high presence of SAV, consistent with the findings of the 1995 study.
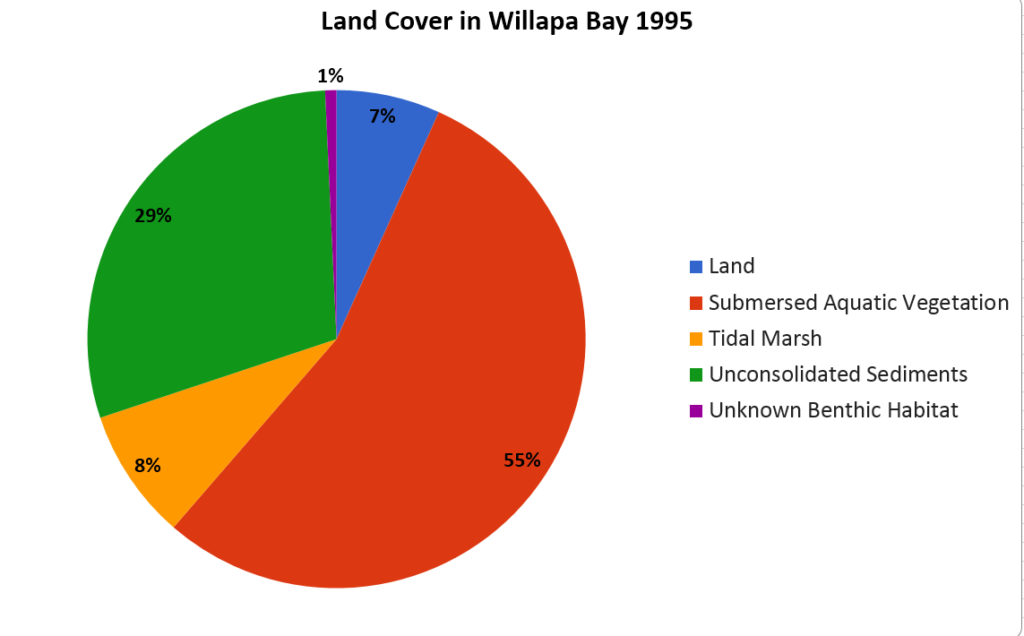
Fig. 3 Pie chart representation illustrating the relative abundance by percentage of land cover types
According to the metadata in the GIS data files, the overall accuracy in their field measurements was 81.02% for the 95 sites visited in the bay. Of note is the primary method of data collection used in this study: aerial photographs.
Reflections: The purpose of this lab was to help us students re-familiarize with the ArcGIS software through the Willapa Bay example, and I believe it was very successful. Looking ahead, I feel comfortable in tackling larger and more complex scenarios using ArcGIS, a software I know will be extremely useful during and after my time at Lewis & Clark.