As our last structured exercise working with ArcGIS software, we studied the aftermath of Hurricane Katrina on the three coastal counties of Mississippi. This exercise involved more complex use of the software’s impressive capabilities, check out the results below! I have structured this post in a “preliminary report” style that attempts to concisely and accurately inform readers of the situation and my recommendations.
Our objectives: Inform federal officials on where to send resources and disaster aid through maps.
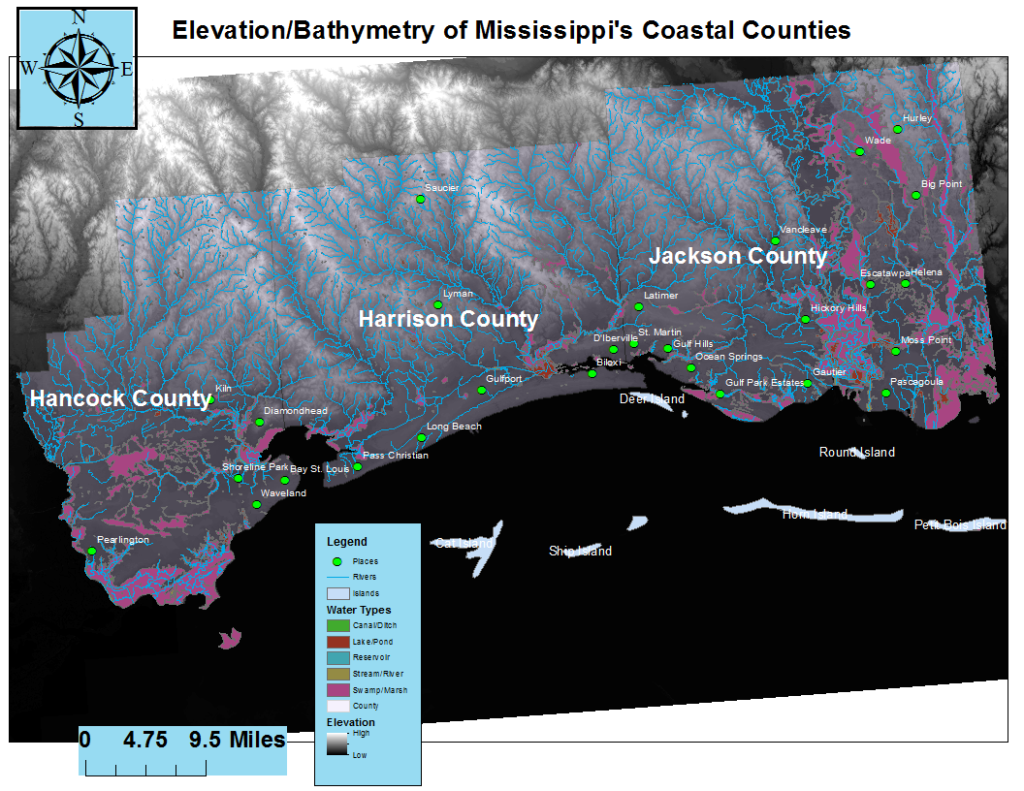
- Hurricane Katrina’s path included the heavily hit coastal counties of Mississippi. Here is a map showing elevation, places, types of water, and islands of the area in question for reference and familiarization purposes.
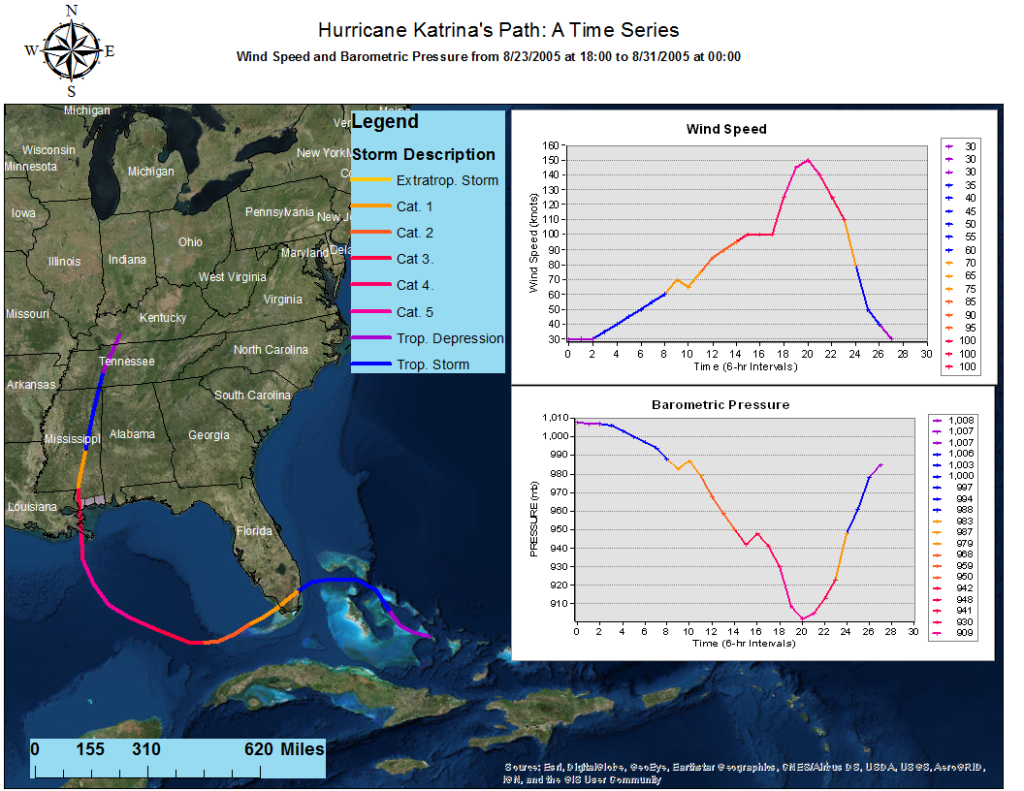
- Next, we must observe the development and path of Katrina. The following map contains valuable information on both these factors, including wind speed and air pressure over time. Of particular note is that the eye of the storm passes right over Hancock County and that wind speed peaks just before hitting Louisiana. High wind speeds cause destruction on-land, and thus developed, low-lying areas hit with high wind speeds should be placed higher on evacuation priorities.
- The storm surge of hurricanes often causes flooding, and this was the case for low-lying areas in Mississippi’s coastal counties. Using information about the elevation of lands (see map 1), we calculated which areas would be flooded by the 7ft storm surge created by Katrina. For further surface analysis purposes, there is a pie-chart illustrating the proportions of land-cover types flooded.

- The following table shows much of map 3’s information in tabular form, which is useful for comparison purposes.
Land-Cover Type Acres Sq. Miles Barren 4376.254 6.837897 Water 29271.33 45.73645 Agriculture 21016.34 32.83803 Forest 36439.65 56.93695 Developed 47163.88 73.6934 Wetlands 169367.7 264.6371 Not flooded 856535.7 1338.337 - Now that we have ideas of the types of land flooded, we must outline specific points of interest, namely infrastructure and health facilities that are at risk of damage or damaged from the storm surge. The below map pinpoints major roads and highways, hospitals, airports, and churches as points of interest.

- Lastly, we have a multi-map analysis of landcover derived from Landsat Thematic Imagery. These can aid in cross-checking the landcover data that was used to create the previous maps.
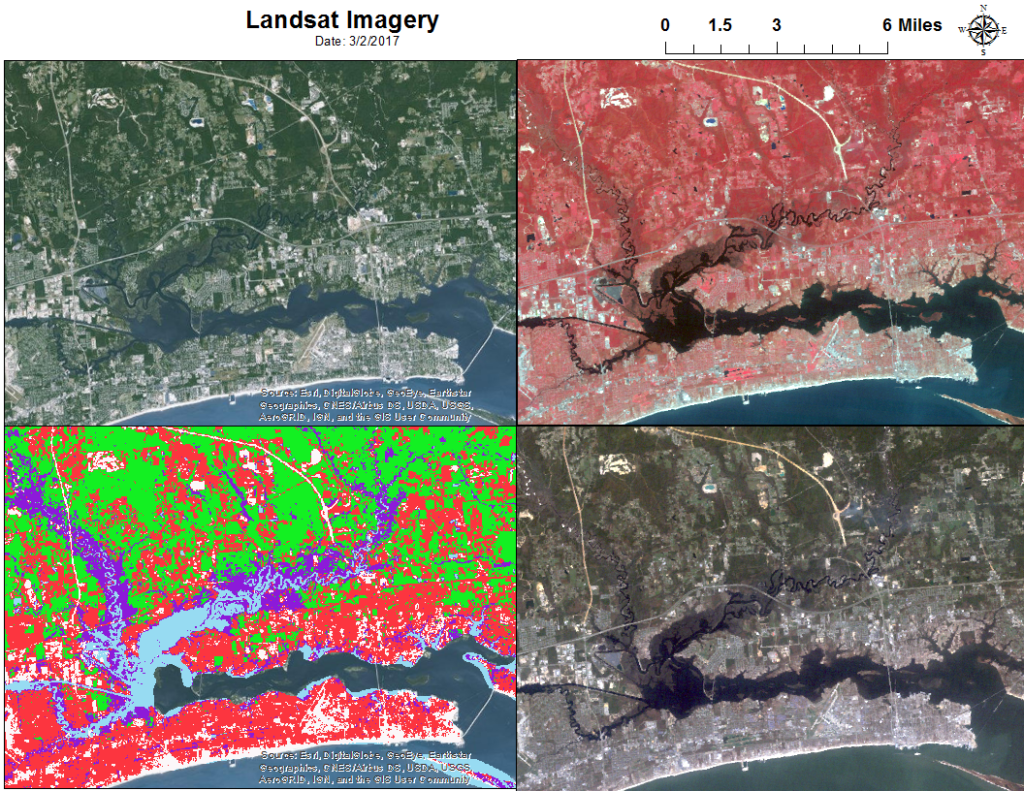
Upper left (world imagery), Upper right (true color composite 321-RGB), Lower right (false color composite 432-RGB) and Lower left (iso cluster)
Analysis:
As mentioned before, our objective is to inform federal officials on where to send resources and disaster aid through maps. We have created maps showing a plethora of information to help us achieve our goal.
Map 1 is essential to gain a surface understanding of the elevation and to a certain extent topography of the affected areas in Mississippi. It shows a hazardous situation that involves densely populated regions in low-lying areas vulnerable to relatively minimal changes in sea level. From this map, we can see that the immediately coastal communities may be in the highest need for disaster relief. While no doubt pertinent to the case at hand, map 2 gives us information on the storm at large.
From map 3, we can see that the flooding is heaviest in Hancock and Jackson counties, with Jackson county’s wetlands suffering the most damage; thus, disaster relief resources should prioritize Hancock and Jackson counties. The flooding in these counties will affect the ability of wetlands to act as buffer zones for future storms. Airports in Hancock and Jackson counties were flooded. When “places” are labeled, it is easy to pick out metropolitan areas that were flooded: Pearlington, Shoreline Park, Pass Christian in Hancock County; Biloxi in Harrison County; and GUlf Park Estates, Moss Point, Rascagoula, Escatawpa, and Helena in Jackson County. It seems as though Jackson County suffered the most in terms of wetlands flooded and developed areas affected, Hancock County also suffered flooding across much of the southern half of the state while Harrison County’s flooding was isolated and to a lesser extent than the flooding in its two neighboring counties.
In any disaster response, access to needy areas is crucial. Therefore, map 4 is crucial in outlining the specific areas of specific infrastructure that need attention. Arterial roads in the flooded zones shown in map 4 must be restored to working condition in order to provide access from evacuation zones and treatment areas to needy districts. Interestingly, the land deemed “low-lying” in map 1 seems to contradict the flooding calculated from the storm surge in map 4. Thus, disaster relief may not be needed in all the areas seemingly at-risk in map 1; instead resources should be concentrated in the flooded areas shown in map 4.
Long term:
In terms of developed lands, developers should rebuild infrastructure to withstand periodic hurricane and other natural disaster-induced flooding, ultimately creating more resilient developed areas on the coast. The agricultural lands affected (primarily in Hancock County) may be moved further upland to prevent losses from future flooding events.


Leave a Reply