Researchers: Ariel Gold, Daphne Yuen, Kara Scherer, Jacob Weiss, and Oscar Cojocariu
Introduction
Mount Fuji, the highest volcano in Japan, is known globally for its iconic symmetrical form. The volcano is composed of four different volcanoes (see Figure 1). The composite nature of Mount Fuji causes the surrounding area to consist of several different types of lava.
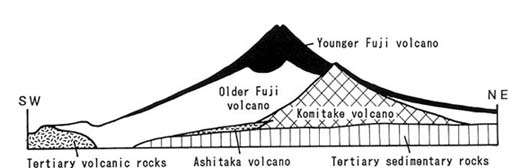
Figure 1
Mount Fuji has a history of erupting in a variety of ways. For example, in 1707, Fuji erupted explosively, but in 864 AD, the Aokigahara lava flow was created as a result of a runny high volume flow. As a result of Mount Fuji erupting in various ways, each lava flow has different characteristics. For example, the Aokigahara lava flow is over one hundred meters thick, while the Takamarubi and Kenmarubi lava flows are only a few meters thick. These distinctive physiographic characteristic may encourage the growth of different kinds of tree species and human uses.
Conceptual Framework
After visiting several locations prior to starting our research, several members of our group realized that there were many variables (weathering, land use, etc) that could influence the type of vegetation that colonizes lava flows. We hypothesized that we would find more species diversity in areas that have not had recent human or natural disturbances because these areas would have more time for various species to grow. Furthermore, Watanabe Michihito, ecologist at the Mount Fuji Nature Conservation Center in Yamanashi Prefecture, supported our hypothesis when he told us about how reforestation efforts made after World War II often resulted in the uniform planting of red pine trees via helicopters dropping seeds over lava flows (in the case of the Kenmarubi lava flow).
Watanabe’s emphasis on the pioneering nature of red pine trees caused us to question their significance on the lava flows. We were particularly interested in the presence of red pine because red pine is an early successional species that colonizes the rocky substrate found on lava flows. Additionally, according to the article, “The origin of pine forest on Kenmarubi lava flow on the lower slopes of Mt. Fuji” by Ohtskua et al. (2003), red pine is a prominent species on Kenmarubi lava flow due to human intervention (timber, coppicing, etc).
From the hypothesized variables we formed the following research questions:
How does human or natural intervention affect the types of trees present?
Does the geological landscape (e.g. rock porosity) influence the tree species diversity and density?
Do each of the three lava flows have the same dominant tree species?
Methodology
We collected data using several different methods. Firstly, we worked with our classmates who were conducting parallel studies on the geology and history of the area to determine what areas had a history of human intervention. Our classmates evaluated land use maps to locate plots of land to survey in our field study. Once we arrived at a prospective field site, we then used a tape measure to move twenty meters into the forest away from trails or roads in order to avoid edge effects.
While most of our chosen plots were located on lava flows, it is important to note that some survey sites were documented off of lava flows, on the edge of a lava flow, or in the case of the “Old” site, an unnamed lava flow that was older than the three studied.
We designed a survey using Fulcrum, a mapping data program on our iPads, to characterize the vegetation in a given 10×10 meter plot. We decided to use a 10×10 meter plot because we had a time constraint of only four days of fieldwork. 10×10 meter plots are large enough to gather information representative of the various sites we surveyed, but small enough so that we were able to site multiple plots in a given area. The Fulcrum survey helped us to categorize each research site by name, tree species, tree diameter, and general land cover (including rock exposure, terrain, and saplings).
Our survey protocol was as follows:
Locate a plot of land 10×10 meters (20m away from the trail)
Rope off area
Split into teams of two to complete Fulcrum survey, which included:
a. Site name/date
b. Tree Species, Diameter (must be over 5 cm to be catalogued)
c. Rock exposure
d. Photos (of tree and general landscape)
e. Notes on general landscape
f. Miscellaneous notes.
After we administered this survey in the field, we exported the information as a CSV (comma-separated values) file and manipulated it to create individual summary categories for the density of trees and the species diversity. We then imported this data into QGIS (Quantum Geographic Information System) and created maps to visually represent the information. In order to create pie charts to display species diversity, we used Excel to make files for the four different lava flows, and compiled the number of trees in the various sites associated with each lava flow.
Findings:
As seen in Figure 2, there wasn’t a clear conclusion we could draw from the data that was collected on Aokigahara, Takamarubi, and Kenmarubi lava flows. Each lava flow contained between four and six different tree species, with the exception of one site just off the Takamarubi lava flow that only had one species because it was a monoculture plantation. Generally, the Aokigahara lava flow had the highest species diversity at each site that we surveyed, containing either five or six different species. It is important to note, however, that the five or six species present on each lava flow were not constant (see below).
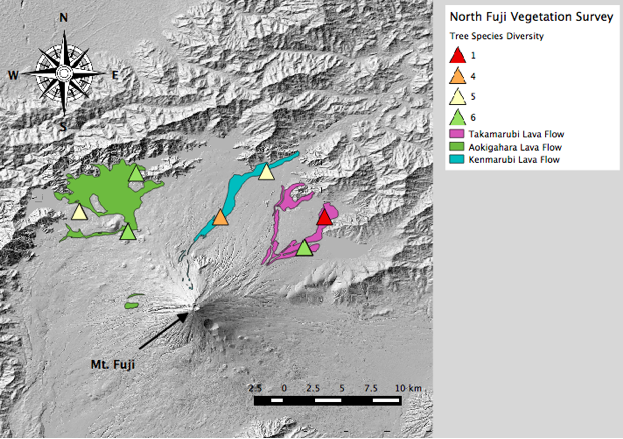
Figure 2
Figure 2 shows the three lava flows surveyed: Aokigahara (green), Takamarubi (purple), and Kenmarubi (blue). The red triangles represent areas with one tree species; the orange triangles represent areas with four tree species; the yellow triangles represent areas with five tree species and the green triangles represent areas with six different tree species.
As seen in Figure 3, the Aokigahara lava flow generally had the highest density of trees. The circle located to the left of the Aokigahara flow is an example of a site we visited that was actually not on a lava flow, so when taken into account Aokigahara clearly has the highest tree density. Additionally, at certain sites, where there was one dominant tree species, we were told to only document the tree species that were not dominant, due to limited time and resources. Our decision to omit certain tree species alters the density of trees at certain sites.

Figure 3
Figure 3 shows the density of trees on Aokigahara, Takumarubi, and Kenmarubi lava flows. The size of the circle corresponds to the tree density of an area; a larger size indicates a higher density of trees.
As depicted in Figure 4, the Aokigahara lava flow had the highest tree species diversity out of the three lava flows surveyed. Beech and sakura (cherry trees) were two of the most prominent trees on the Aokigahara flow. Also present were cypress trees, historically used for building houses because the wood is straight and hard. Though hemlock and akashide (hornbeam) trees are not as sturdy as cypress and not used for building homes, they may have been used for firewood.

Figure 4
Figure 4 shows that the Aokigahara has the highest tree species diversity out of the three lava flows, with akashide, cypress, and hemlock being the most dominant in the area.
Figure 5 shows the tree species in the Takamarubi lava flow; the tree species diversity is not as high as the Aokigahara lava flow. This is due to a monoculture plantation of enju (Pagoda tree; Styphnolobium japonicum) as well as intentional planting and protection of the haramomi (tiger-tailed spruce) trees on the Takamarubi lava flow.

Figure 5
In Figure 5, the prominent tree species on the Takamarubi lava flow are enju (Pagoda tree) and haramomi.
As shown in Figure 6, the Kenmarubi lava flow showed moderate levels of tree species diversity. At the Kenmarubi site we found a large number of trees that had been coppiced, leading us to believe this site had relatively intense human disturbance, which possibly influenced the lack of species diversity in our plot. However, Takamarubi Site 2 contradicted our hypothesis, since this site was located next to the Inai shrine and was created by humans. Most of the plants next to the shrine were planted for aesthetic reasons and were rare species not native to the area.

Figure 6
In Figure 6, Cedar and Japanese Maple are the most common tree species on the Kenmarubi lava flow.
The “Old” lava flow site was based on an older lava flow adjacent to the Aokigahara lava flow. At our site, the ground formed a hill with a steep gradient; it was on this slope that we drew our boundaries and started surveying. There was very little to no coppicing here, and very few signs of serious human involvement. The steep gradient of the hill may explain why this area may not have been utilized as much for timber. This area also seemed to house a healthy plant community, indicated by a thick ground cover layer of decaying organic material.

Figure 7
Figure 7 shows akashide and mizunara (a type of oak) being the most prevalent tree species on the “Old” lava flow.
Conclusions
Since we were unable to determine the thickness of the lava flow our plots were located on, we are unable to make many broad conclusions about how geology influenced vegetation. Therefore, our research into the question of how differences in soil substrates may deter, constrain, or otherwise affect human management is inconclusive. Furthermore, our plot locations were chosen based off of the historical significance of a given location, not a methodology aimed at reducing as many variables as possible.
We originally thought we would see many red pine trees in rocky areas of the lava flow because red pines, a pioneer species, do well in rocky soil. The human uses for red pine are fairly limited because of its often irregular morphology. The primary uses of red pine trees include firewood fuel and pine pitch, which is extracted from the roots to be used as fuel in oil-burning lanterns. Over time, the necessity of red pine as a fuel source has decreased, as fewer households and businesses use fireplaces for heating and the majority of the nation has switched to electric energy to provide light. The reduction in demand for red pine, which was already a tree with limited usage, may explain the scarcity of red pine relative to our expectations. The site where red pine had the highest population was on the Kenmarubi lava flow because it was planted by humans (see Figure 6).
After analyzing our data in conjunction with the geology group, we were surprised that there were not more connections between our data. We thought that there might be some correlation between soil depth or rock porosity and species present, but after finding no strong connections, our group realized that this might be due to the sites that we surveyed. Since the history group decided where to go each day, all the sites we surveyed inevitably had some kind of recent human intervention. These disturbances occurred after the lava flow, so the species diversity wasn’t representative of the successional stages that we thought would occur after a lava flow. There are a variety of factors that could influence species diversity and tree density including other human and geological factors. Two other studies were conducted which focused specifically on human disturbance and soil and rock content. Further analysis and collaboration with these two project groups could help give a fuller explanation of the variety of tree species and concentrations.
We found that the Aokigahara lava flow had the highest tree species diversity out of the three sites we surveyed. Since these findings did not correlate directly with the geology of the area, it might point to the presence of more human intervention. As noted in the article, “Community structure and dynamics of coniferous forests on Aokigahara lava flow, Mt. Fuji, Japan,” the Aokigahara lava flow might have been “affected by human disturbance, such as using deciduous trees for charcoal within the forest” (Otsuka et al 2008). Though we cannot draw concrete conclusions from our surveys, we can use this as a possible explanation for the tree species diversity and density that occurred within the Aokigahara lava flow.
It is difficult to determine what caused the varying species diversity within our sample areas. However, we were able to make generalizations about how coppicing could influence the species we catalogued. Factors such as planting selective species, promoting certain species (thinning forests of unwanted trees), planting certain types of seeds (dropped by helicopters after the war), or humans or animals inadvertently bringing various seeds of tree species into the area caused a spectrum of possibilities. We are able to draw tentative conclusions based off our observation of coppiced trees, which were spotted at most of the sites. The coppicing of trees may have also inadvertently allowed for greater species diversity (due to increased light availability, etc.). Humans were not trying to influence the species diversity while coppicing trees, rather they were just using the land to harvest timber and may have unknowingly created an environment hospitable for other tree species.
If we had more time to perform this study, we would increase the sample size to promote more replication and randomization within the plots for a more accurate representation of the entire lava flow. In addition, it would have been beneficial to expand our vegetation survey beyond the scope of tree species, given that ground cover and smaller foliage can give crucial clues in distinguishing and analyzing land plots.
Works Cited
Batdorff, Kara A. 2014. “Mapping a Mountain: Mt. Fuji Land Cover Transitions Over the 20th Century.”
Otsuka, Toshiyuki et al. 2003. “The origin of pine forest on Ken-Marubi lava flow on the lower slopes of Mt. Fuji.” Journal of Vegetation: 20 (1): 43–54.
Otsuka, Toshiyuki et al. 2008. “Community structure and dynamics of coniferous forests on Aokigahara lava flow, Mt. Fuji, Japan.” Journal of Vegetation: 25 (2): 95–107.
Images
Figure 1: http://www.eri.u-tokyo.ac.jp/VRC/vrc/others/fujigeol.html
Vegetation Survey Files (Excel and Word formats):