In our most recent exercise as students of Jessica Kleiss’s GEOL 340 Problems in Spatial Science course, we used publicly available data to research our own questions regarding demographics. Naturally, I went back to my roots where I grew up, Torrance and the larger Los Angeles County. I took demographics data and tried to further my understanding of where “Asian Neighborhoods” existed in LA County.
To achieve my goal, I first needed to obtain shapefiles and data from the internet, as they were not provided to us in this exercise. I first went to FactFinder to download “Race” data from year 2000 for L.A. County. I then navigated to TIGER/Line to obtain shapefiles for California Block Groups. I could then create a map of L.A. County by block group and subsequently join the demographics data to this map using skills learned in previous exercises and courses. The result: each block group contained block group-specific demographics data. It was then a trial-and-error to find which methodology worked to best represent X racial group’s representation within each block group in LA County. I decided on displaying three race groups (Asian, White, Black) by percentage residing in the block group (data was normalized to the year 2000 population data, which was also in the original FactFinder data file). The result were three maps with racial representation data, of which one (Asian) I focused for further analysis.
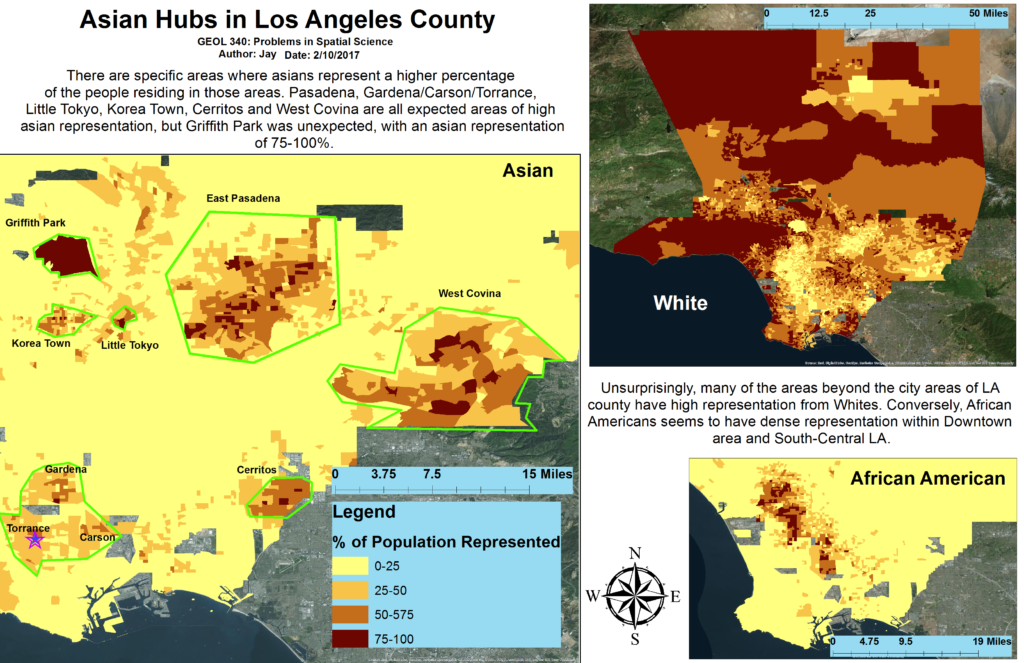
Note that there is a typo error in the Legend. “50-575” should say “50-75”
I looked at areas with high representation (50-100% of population Asian, shown outlined in green in the map below) and cross-referenced those block groups with Google Maps to assign neighborhood names to those areas. Of particular interest is Griffith Park, where there is high representation; I did not realize people actually lived in Griffith Park! This may be due to a very few residences, of which most are Asian, that were included in the block group of the Griffith Park area. The star marker located in the southwest quadrant of the map denotes the area that I grew up in: Torrance. Other Asian neighborhood include Korea Town, Little Tokyo, East Pasadena, Cerritos, Gardena, and West Covina. I always considered Torrance, my homeland, to be an area with high Asian, specifically Japanese, populations, but looking at the 2000 data, there seem to be other areas that are much larger and denser Asian neighborhoods. I would attribute my observations to subjectivity, for I usually surrounded myself with other Asians and spending time mostly in Asian neighborhoods within Torrance.
All in all, this exercise was a great opportunity to practice some essential GIS skills such as downloading/cleaning up data, joining, clipping, and symbology display. I definitely am more confident in using spatial software as one more method to answer the world’s questions.
Leave a Reply