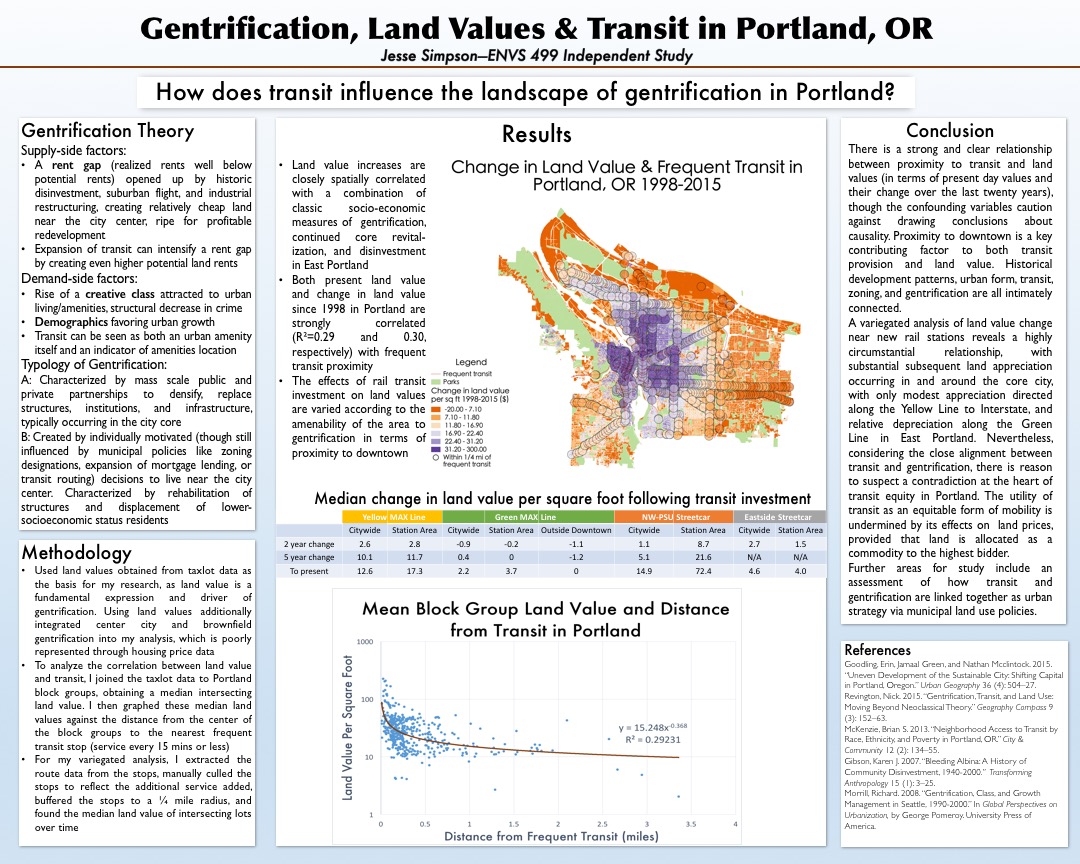
This week, I pushed forward on the variegated historical analysis of land values near transit capital extensions and created a poster draft. I settled on examining the four major expansions for which the taxlot data I had were applicable—the Northwest to PSU streetcar (2001), the Yellow Line (2004), the Green Line with the new transit mall (2009), and the eastside streetcar (2012). I compared the median change in land value within a quarter mile radius of each set of stations to the citywide median for three year points—two years after opening, five years after opening, and up to the present day. The data is somewhat equivocal, with the NW-PSU streetcar registering significant appreciation, the Yellow Line showing land appreciation modestly above the citywide median, and the Green Line and eastside streetcar being associated with either a slight depreciation or appreciation below the citywide median. I intend to examine this data further with a statistical analysis of the significance of these differences, and perhaps through a comparison to the change in land value seen for the years preceding the transit investment.
My poster draft is posted below, notwithstanding the potential inclusion of some more tabular data, the full results and methodology sections are there. I was a little unsure about how much to include about my examination of municipal planning documents, but I erred on the side of excluding that side of my independent study from the poster considering space constraints and the fact that presenting such a mixed methods, multidimensional poster at the Festival of Scholars would be a little unwieldy. Additionally, though I think the gentrification theory section is necessary and the fact that I’ve already used up most of the space, I also intend to include some additional introduction section to make the whole poster hang together better on first glance. I also recognize that I could expand on my further studies section.
Leave a Reply