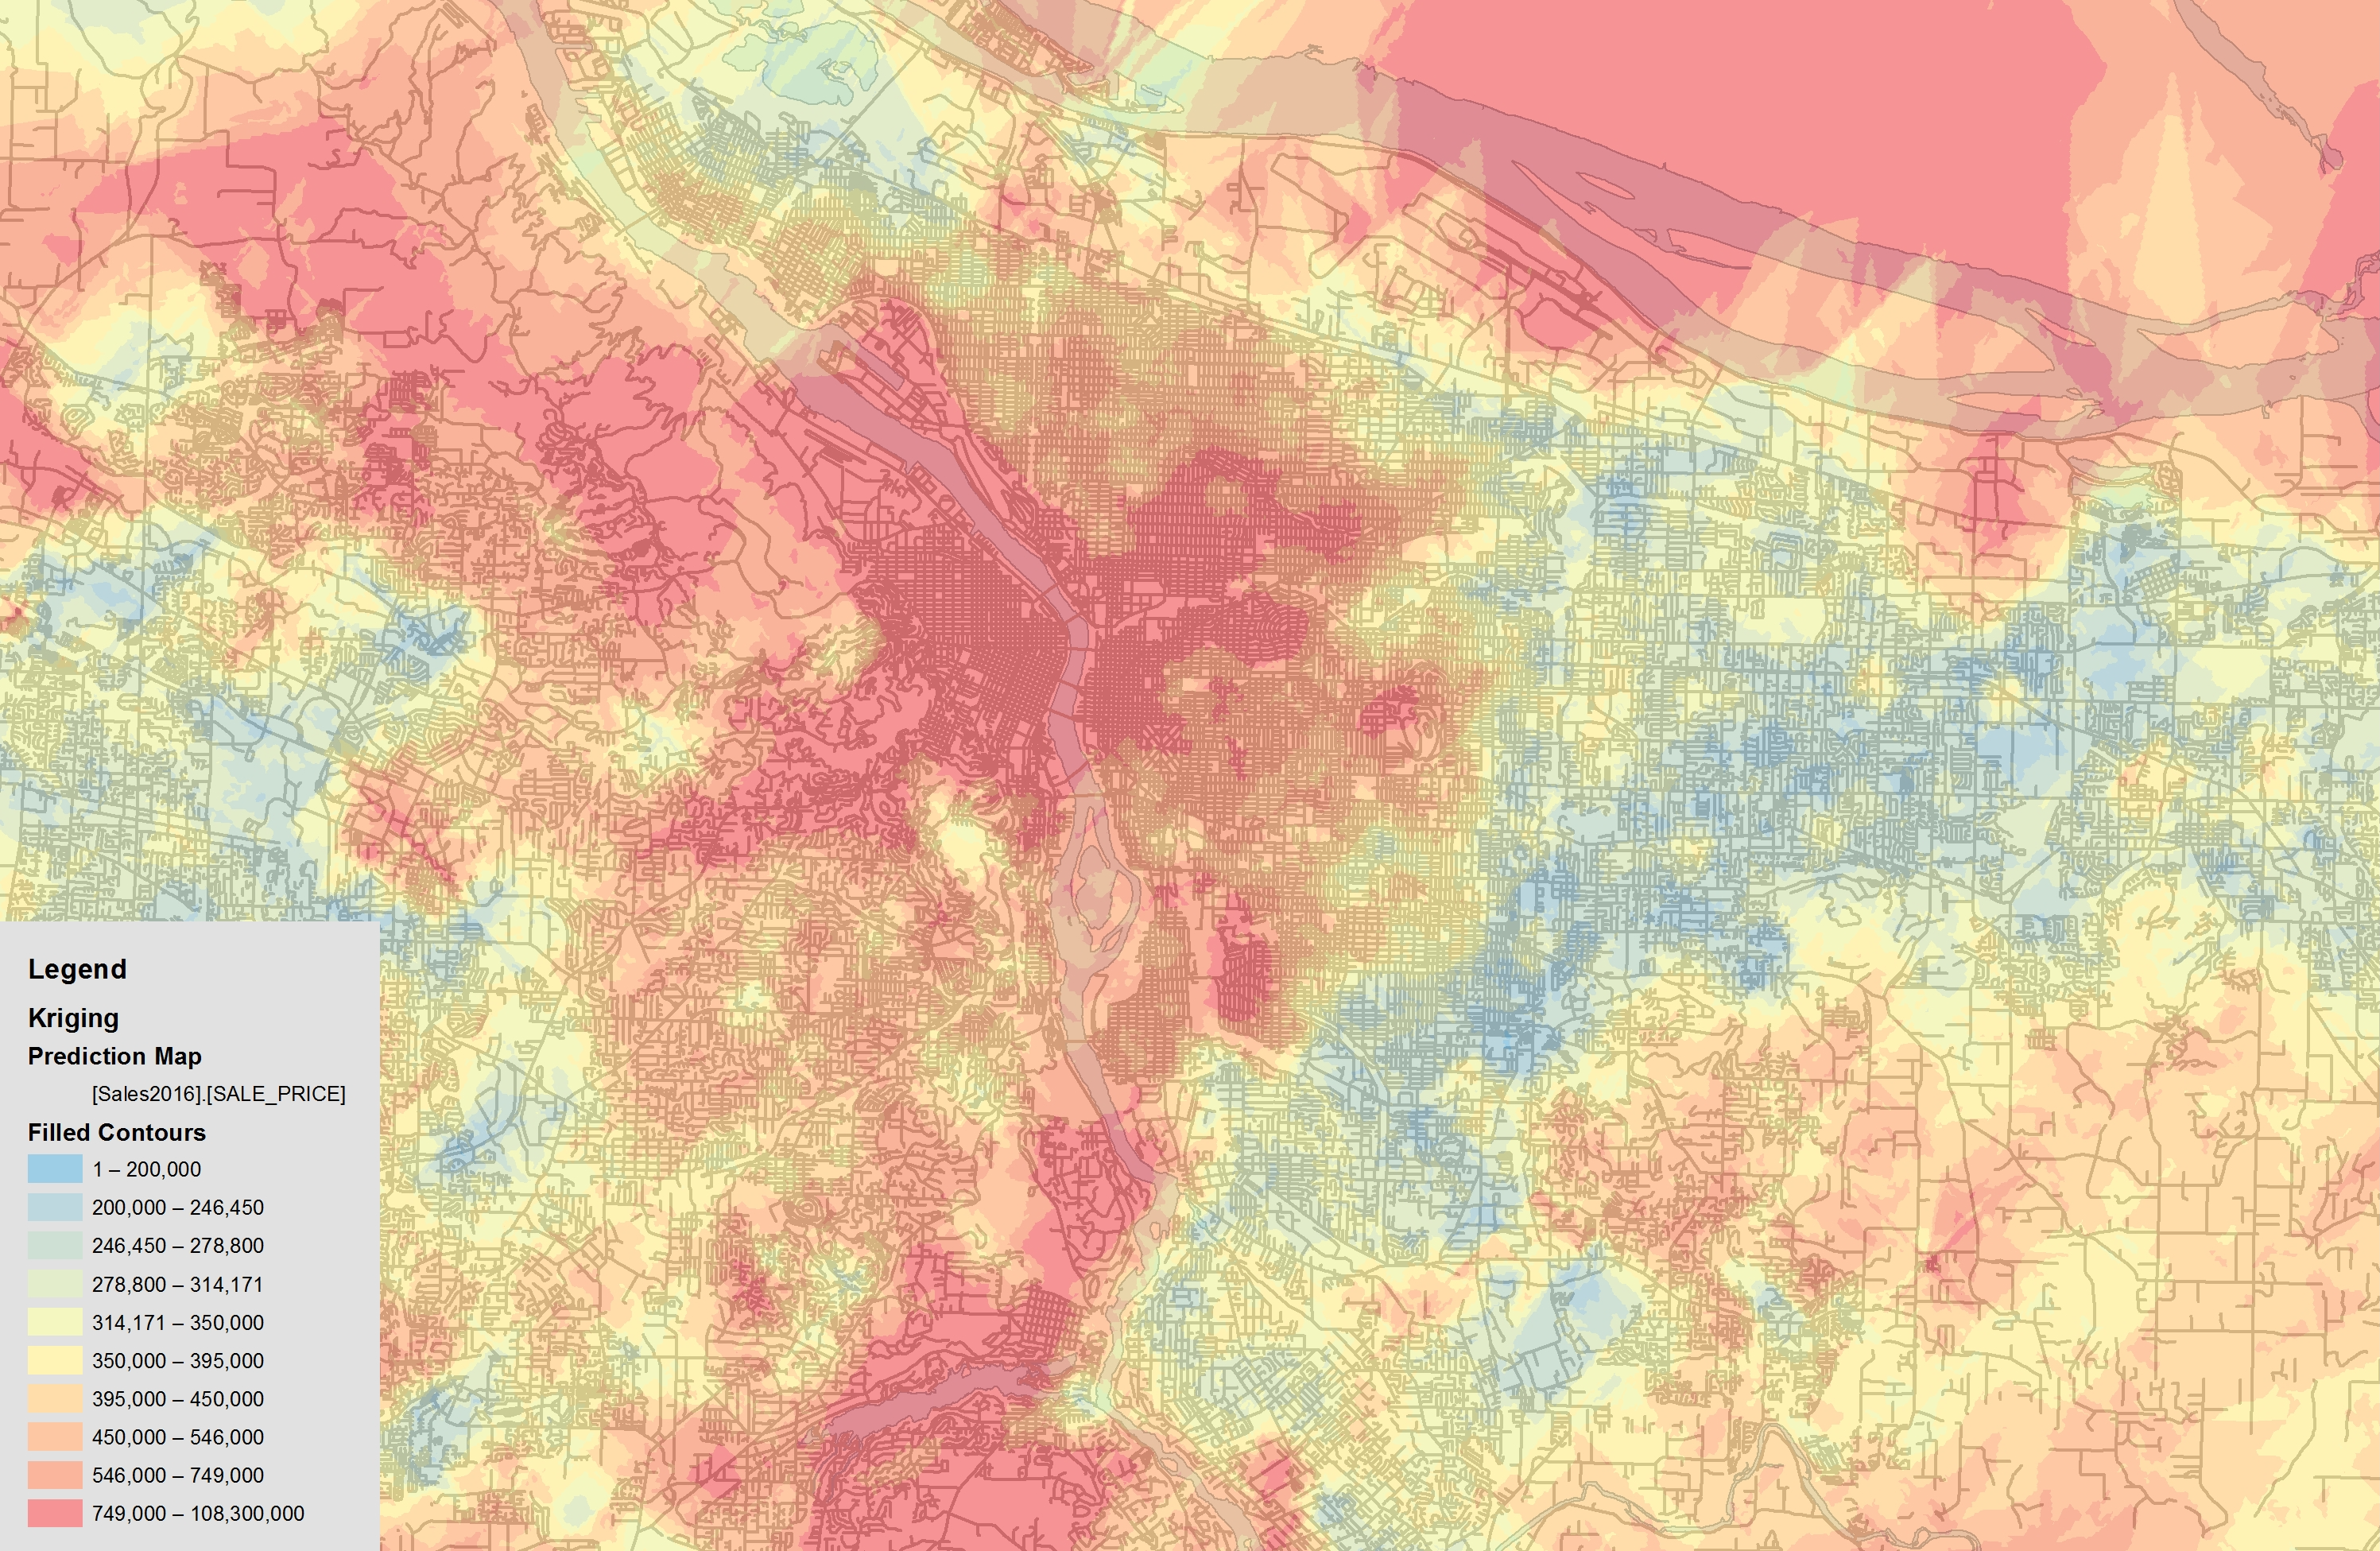
Over this past week, I aimed to run my network distance calculations for each of the taxlots in Portland and set up my linear regression variables. The former goal ended up being more time intensive than anticipated, as it took several rounds of calculation to figure out the optimal way to have ArcGis process the Origin-Destination Cost Matrix for hundreds of thousands of taxlots. In the end, it seems that adding the shapefile as a single feature class to a file geodatabase is optimal. Additionally, after exploring the options for a spatio-temporal analysis, I decided that examining an integrated time-space model was too intensive in terms of my own statistical knowledge and computational power to pursue, at least in terms of data visualization. Instead, I will be examining discreet years. I processed the sales data for 2016 this week, producing an interpolated kriging map of property sale values in 2016.
In terms of linear regression variables, I did not quite meet my goal of setting all of the them up for analysis, though I did make quite a bit of progress. I enumerated the variables I will be using (distance to downtown, distance to parks, school quality, distance to other job centers, distance to freeways, percent of sidewalks improved, proximity to community centers, year built, lot square footage) and created the data for the school quality variable. To do this, I used the school attendance shapefile from Portland and manually added the school attendance areas for Milwaukie, with reference to an online map. I then added the GreatSchools rating for the elementary, middle, and high schools for the attendance areas, followed by averaging these scores. I also realized that the structural variables included within public records are far too sparse for an optimal hedonic regression analysis. These variables are limited to building square footage and the year built, and even for these fields, many attributes have no data supplied. I may need to explore options for attaining for structural home data through Zillow’s API.
In addition to these GIS methods, I created an outline for my project, viewable at the right.