Gephi is an open-source network analysis application, with emphasis on network (graph) visualization. One common application is to visualize social networks. Social network analysis is a highly sophisticated and somewhat complicated methodology; Gephi gives you the ability to explore and visualize social (and other) network data to quickly discover patterns. Gephi can be readily installed on a variety of platforms, and has quite a few existing help guides and tutorials (plus search online for lots of others). A fun way to start learning Gephi is to visualize your Facebook network; try it!
Gephi overview window (click to expand)
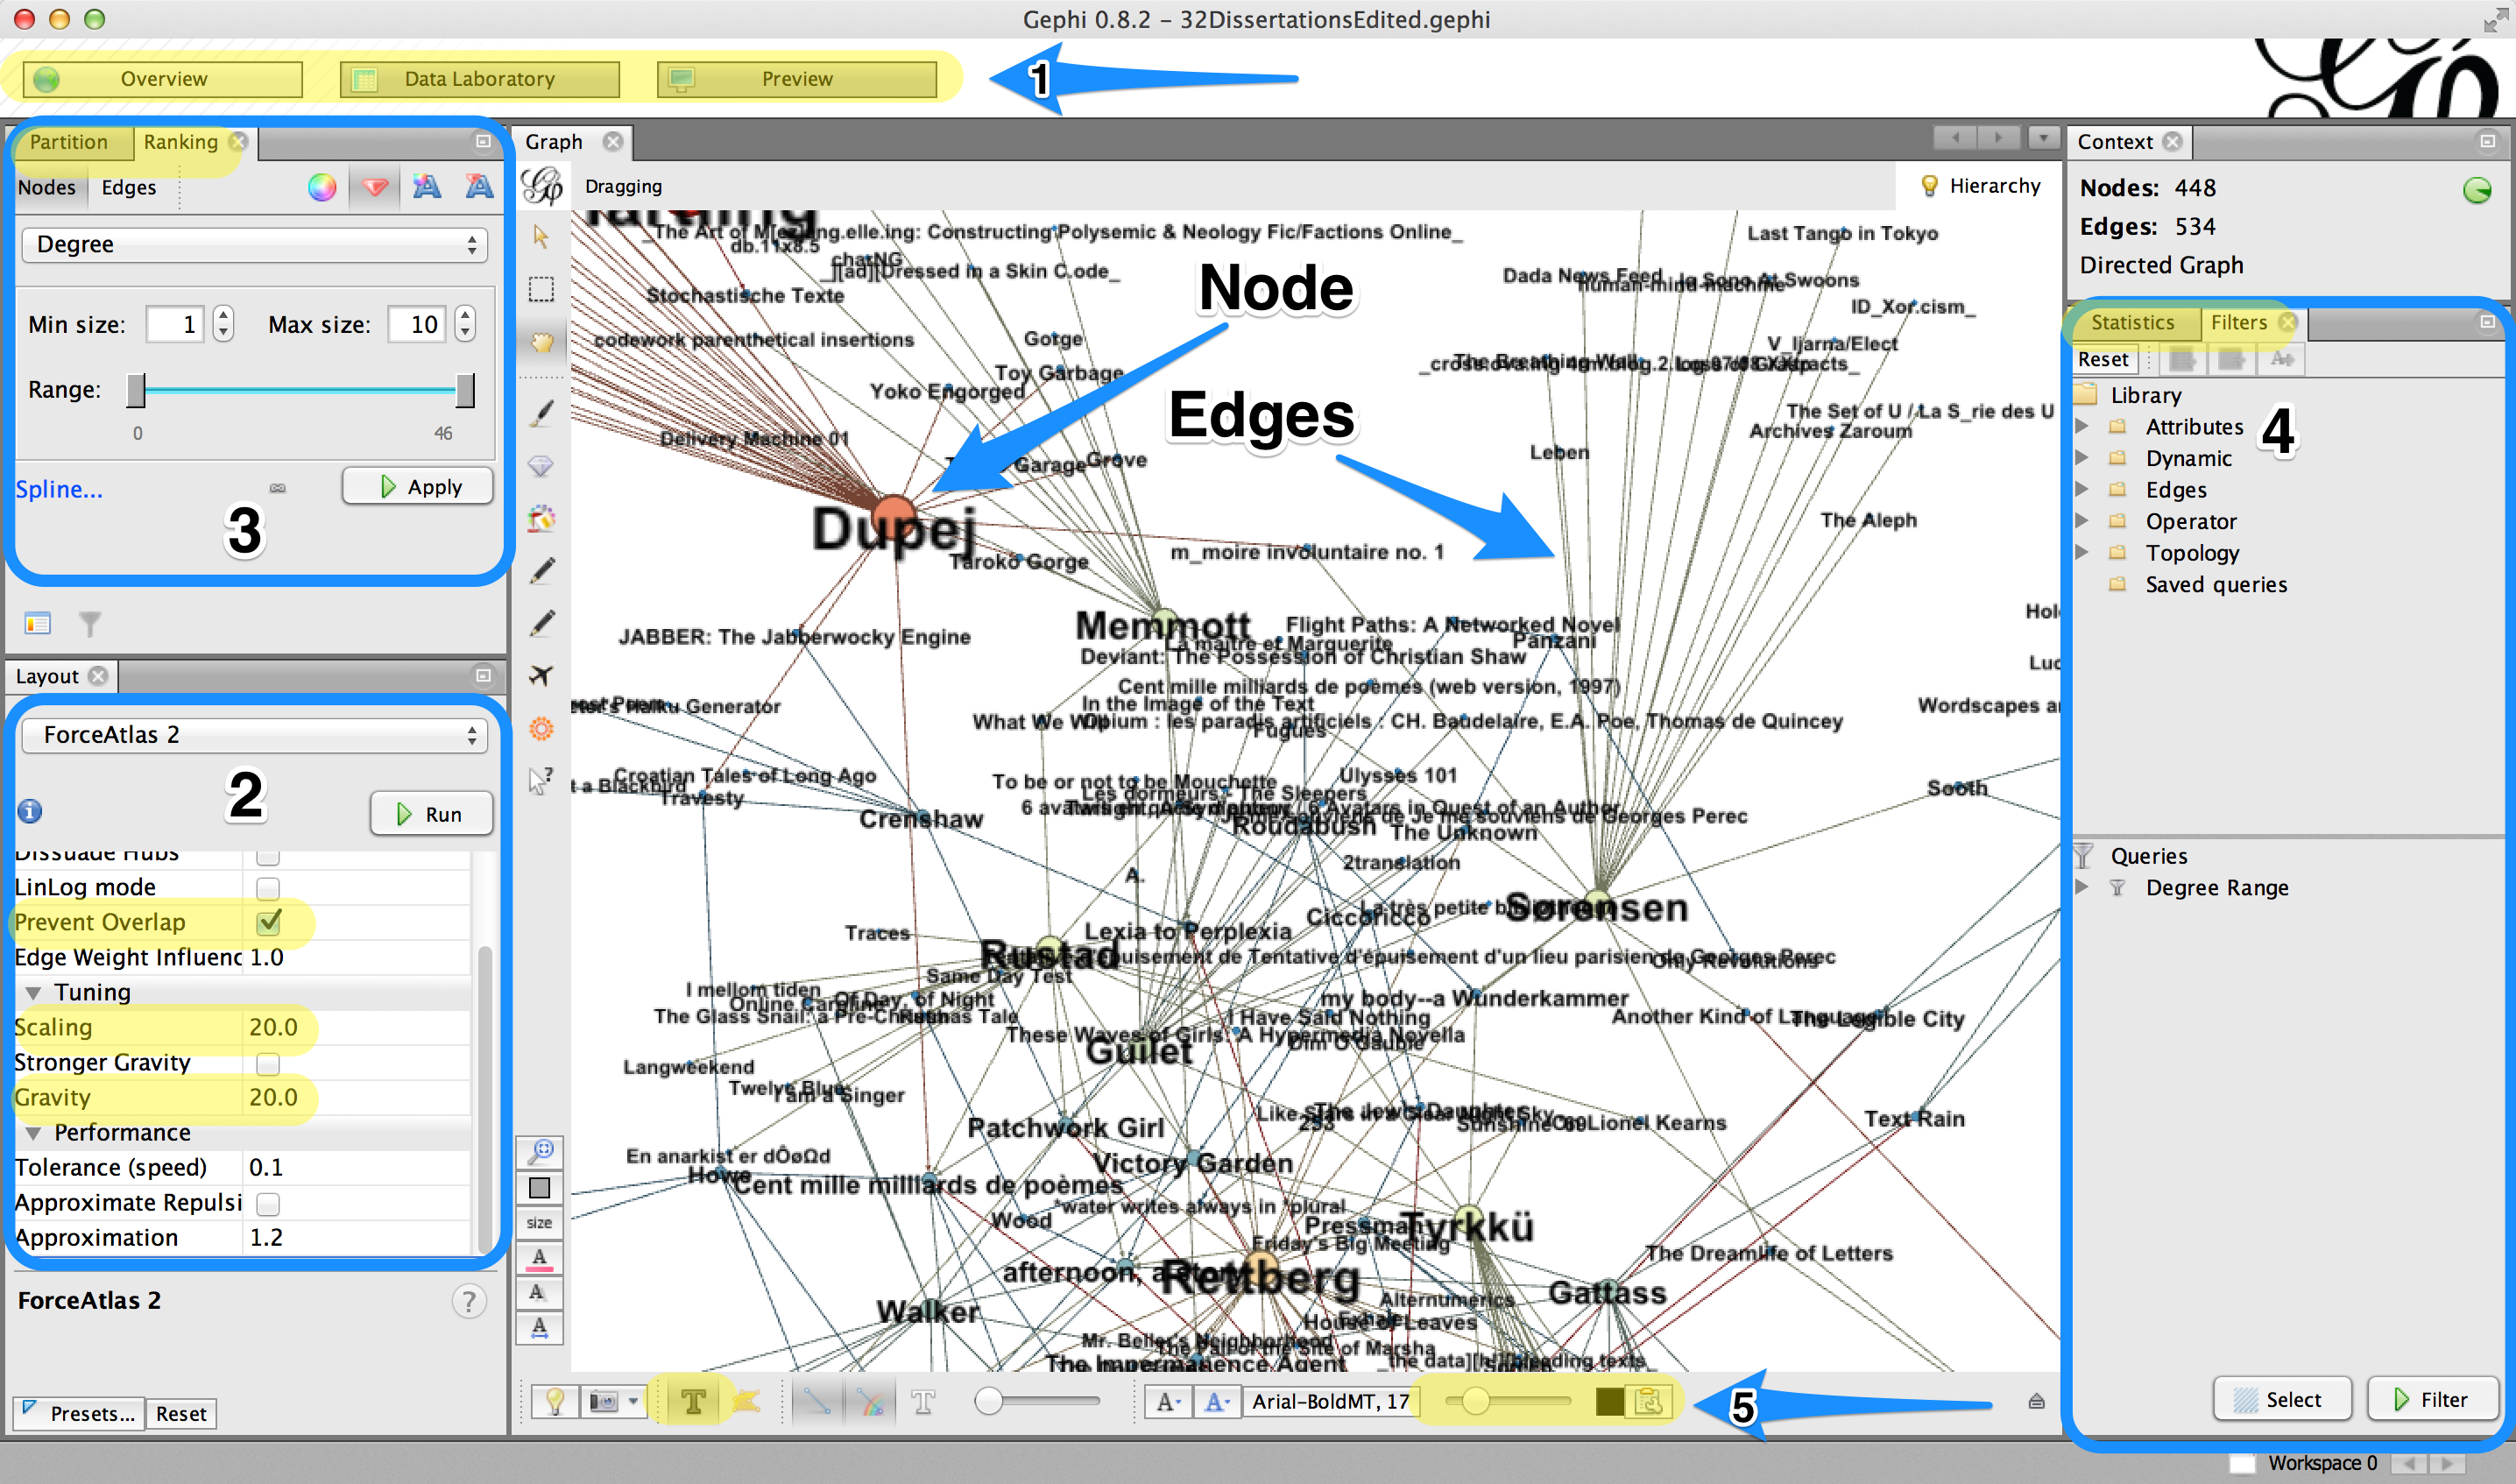
A visual summary of Gephi is at right (for a more detailed description, see here). This summary shows the Overview window. In the middle is a network, consisting of nodes (the objects of a network) and edges (the connections between these objects). Here are some important features:
- The Overview, Data Laboratory, and Preview windows are selected at top. The Data Laboratory is like a spreadsheet of your network’s node and edge data. The Overview window (pictured) is where you will setup your visualization. You can then go to the Preview window (make sure to click Refresh at lower left!) to finalize and export your view.
- The general layout of your network is determined by an algorithm you select at lower left. One common Gephi algorithm is ForceAtlas2, in which nodes repel each other and edges pull nodes together, thus closer nodes share more edges. Prevent Overlap keeps nodes from stacking; Scaling and Gravity are some common adjustments. Click Run, then stop when you are satisfied with the layout.
- Nodes (as well as edges) may have attributes that can be visualized. The Partition tab is for categorical attributes; the Ranking tab allows you to edit your node color, size, and labels according to a continuous attribute. One common attribute of a node is degree, the number of edges that connect to a node. You can go to Statistics (#4 at right) and run the Average Degree routine, which will add degree attributes to your nodes; then you can visualize degree via Ranking.
- You may apply a variety of Filters at right to your network. Topology > Degree Range, for instance, allows you to filter out nodes of low degree (i.e., relatively unconnected nodes). If you apply a filter, you should re-run your layout algorithm.
- A variety of display settings are at bottom, including the ability to display node labels (the T button) and the default size/color of labels (which Partition/Ranking in #3 will adjust).
Have fun using Gephi! Remember, it’s free and powerful but it is beta software, so save your work frequently.