Your posts can include more than just text: if you need to include mathematical equations or charts, read on!
 Mathematical equations
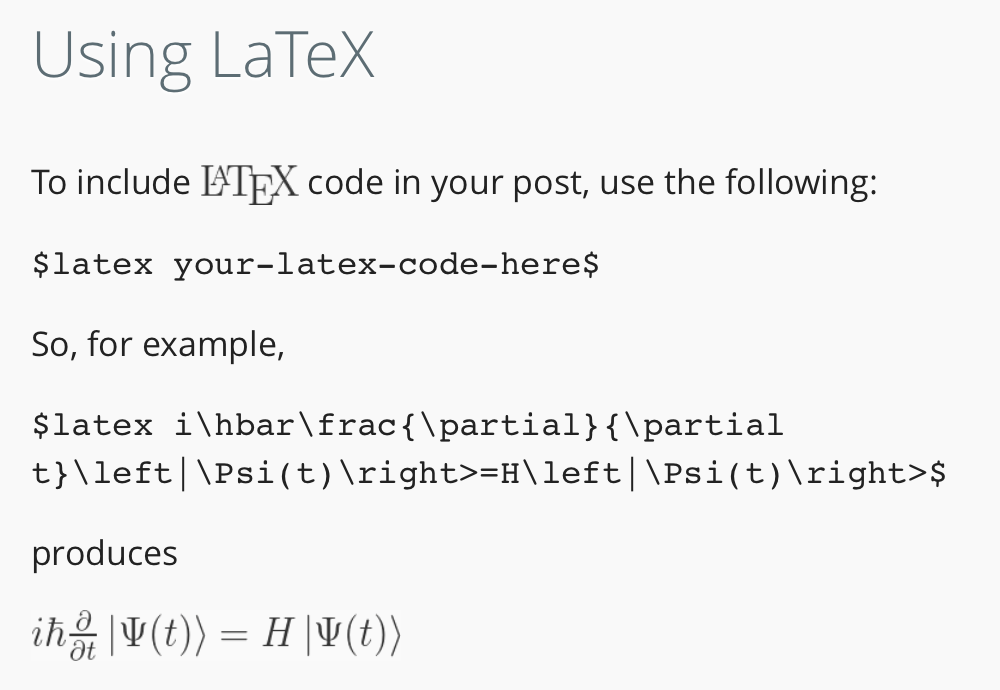
If you need to include complex mathematical equations in your post, just make sure the Beautiful Math Jetpack module is activated, and go for it with LaTeX!
An illustration is at right: you’ll basically bracket your LaTeX code with dollar signs.
Make sure to read the Beautiful Math module page for additional information.
GoogleSheets and Charts
If you are using GoogleSheets to prepare charts you can activate the Inline Google Spreadsheet Viewer plugin to display your GoogleSheet and related charts. The plugin must be activated first and uses shortcode; contact us if you need help, and make sure to read plugin documentation for its many features.
Otherwise, you can always insert a static chart image in your post, or if you are working with a GoogleSheet and your chart is published with “iframe” code, use the iframe embed plugin. Information on publishing and embedding a Google Sheet and associated charts is here…it’s easy, and doesn’t require the Inline Viewer plugin above.
Tables
If your site has the TablePress plugin activated, you can readily insert a table that looks like this. See here for documentation, or just follow the typical steps below.
- Start with table data in Excel or .csv format. Then import your table data via the dashboard, using TablePress > Import a Table.
- When your table has imported, you’ll be directed to a page where you can edit a bunch of settings for that table (or just use the defaults). When you’re happy with the settings, click Save Changes.
- Now you’ll have a shortcode on that page you can insert in a page or post, or just use the Insert Table button to do so!
Note: Through spring 2017, DS used EasyTable, a plugin which is no longer available. If you inserted an EasyTable into your post or page and have activated TablePress, you will see [table “” not found /]. To fix it:
- Edit the page and copy all your data between [table] and [/table].
- Save your copied data as a .csv (a text file with .csv suffix).
- Follow the instructions above, then replace the original table shortcode with the new table shortcode.